

About 3.1 million U.S. workers voluntarily quit their jobs in July 2026, holding the national quits rate at 1.9% for the month (Source: U.S. Bureau of Labor Statistics).
B2B Centr publishes the workforce, spend, and benchmark data that operators use to make headcount and budget decisions with actual numbers instead of assumptions.
Turnover has cooled significantly from its 2022 peak, but the underlying cost has not: replacing a single employee still runs between half and twice their annual salary, and most departures are preventable.
This article breaks down current turnover rates by industry, region, and tenure, quantifies what each departure costs, and shows you how to benchmark your own numbers against the national picture.
Key Takeaways
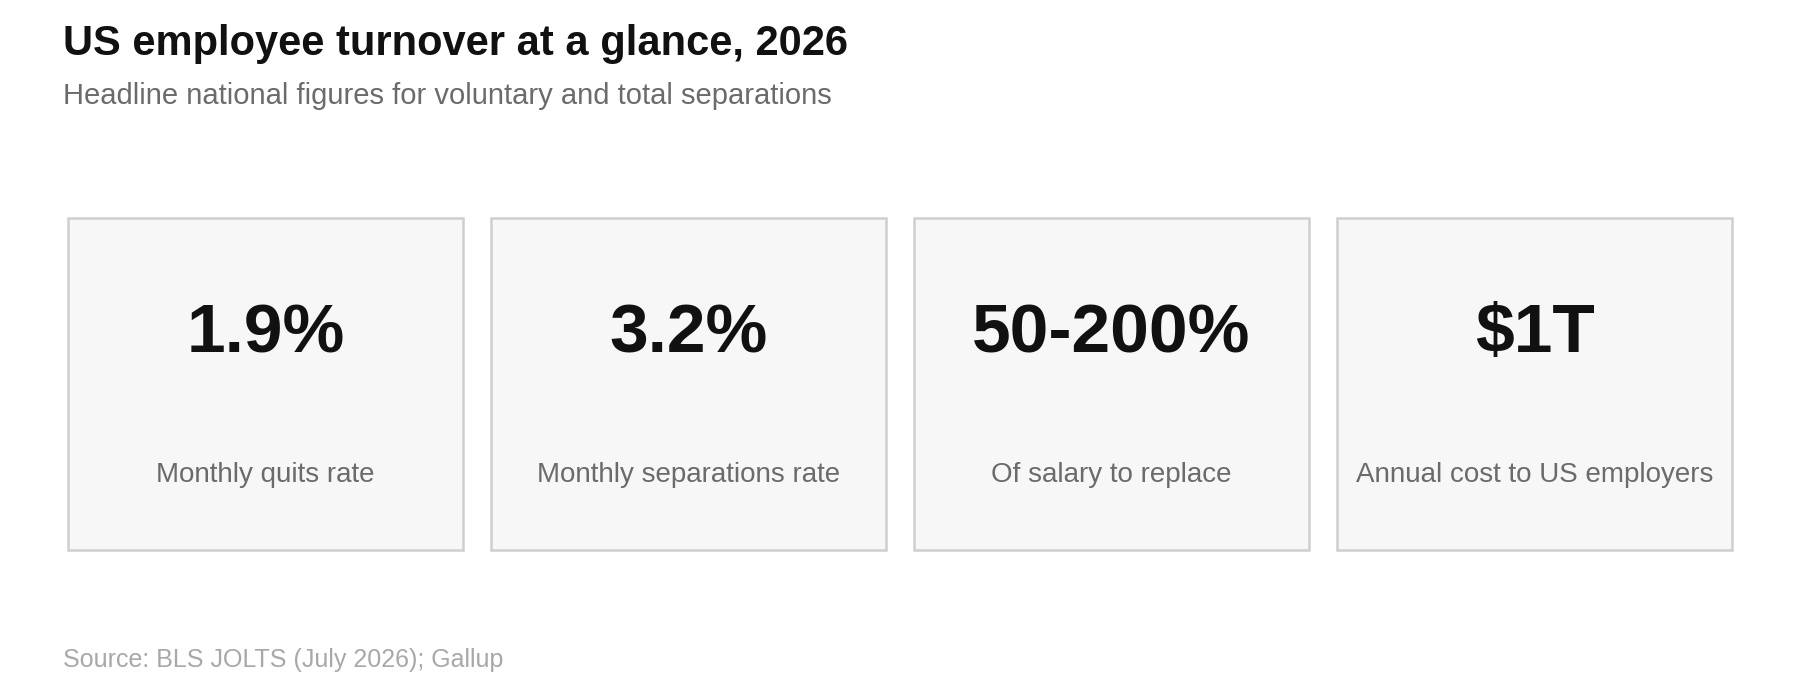
- U.S. quits rate sits at 1.9% monthly, roughly 3.1 million voluntary departures per month.
- Total separations run 3.2% monthly, near 38% annualized across all sectors.
- Replacing one employee costs 50% to 200% of their annual salary.
- Voluntary turnover costs U.S. employers an estimated $1 trillion every year.
- Accommodation and food services leads all sectors at 3.5% monthly quits.
The U.S. Labor Market Backdrop in 2026
Turnover does not happen in a vacuum. It tracks how much opportunity exists elsewhere, and 2026 has been a year of thin openings and cautious movement.
The number of job openings was little changed at 7.3 million in July 2026, a job openings rate of 4.4% (Source: BLS JOLTS).
Hires and total separations both landed at 5.1 million, each at a rate of 3.2%. Within those separations, quits accounted for 3.1 million and layoffs and discharges for 1.7 million, with another 350,000 classified as other separations covering retirement, death, disability, and internal transfers.
That balance matters. When hires and separations run at the same rate, the labor market is churning without growing. Employers are replacing people rather than adding them, which puts retention at the center of workforce planning.
Our 2026 hiring statistics breakdown covers the recruiting side of that equation.
How the Turnover Picture Shifted After the Great Resignation
The 2026 numbers look calm next to what came before them.
At the peak of the Great Resignation in mid-2022, monthly quits hit 4.2 million (Source: BLS). Today's 3.1 million represents a drop of roughly 26% from that high.
Involuntary turnover is telling a different story.
U.S. employers announced 33,429 job cuts in July 2026, the lowest monthly total in two years, yet technology alone accounted for 149,023 cuts through July, up 67% from the same period in 2025 (Source: Challenger, Gray & Christmas).
Artificial intelligence led all cited reasons for the fifth consecutive month.
The result is a two-speed market. Voluntary exits are down because workers see fewer safe landing spots, while involuntary separations concentrate in sectors being restructured around automation.
Teams evaluating HR tech spending priorities are budgeting against both pressures at once.
What Counts as Employee Turnover
Turnover is the rate at which people leave an organization and need replacing, expressed as a percentage of average headcount over a set period.
It splits into three categories that BLS tracks separately:
- Quits: voluntary separations initiated by the employee.
- Layoffs and discharges: involuntary separations initiated by the employer.
- Other separations: retirement, death, disability, and transfers to other company locations.
The standard formula is straightforward:
Turnover rate = (separations during period / average headcount during period) × 100
Most organizations report an annual figure and then segment it by voluntary versus involuntary, by department, and by tenure band.
Reporting a single blended number hides where the problem actually sits.
National Employee Turnover Rates: The Headline Numbers
The monthly rates BLS publishes translate into much larger annual figures once compounded across twelve months.
| Metric | July 2026 level | Monthly rate | Approx. annualized |
|---|---|---|---|
| Total separations | 5.1 million | 3.2% | ~38% |
| Quits (voluntary) | 3.1 million | 1.9% | ~23% |
| Layoffs and discharges | 1.7 million | 1.0% | ~12% |
| Other separations | 350,000 | n/a | n/a |
| Hires | 5.1 million | 3.2% | ~38% |
Source: U.S. Bureau of Labor Statistics
Survey-based benchmarks land lower than the JOLTS annualization because they exclude seasonal and hourly churn.
U.S. voluntary turnover averaged 13.0% in 2025 across 2,617 organizations surveyed (Source: Mercer, via Pin), and SHRM data puts the all-industries average turnover rate near 18% annually (Source: SHRM, via Speakwise).
Both numbers are correct. They measure different populations. JOLTS captures every payroll separation in the economy, including seasonal retail and food service.
Employer surveys capture salaried, benefits-eligible headcount at organizations sophisticated enough to participate.
Employee Turnover Statistics by Industry
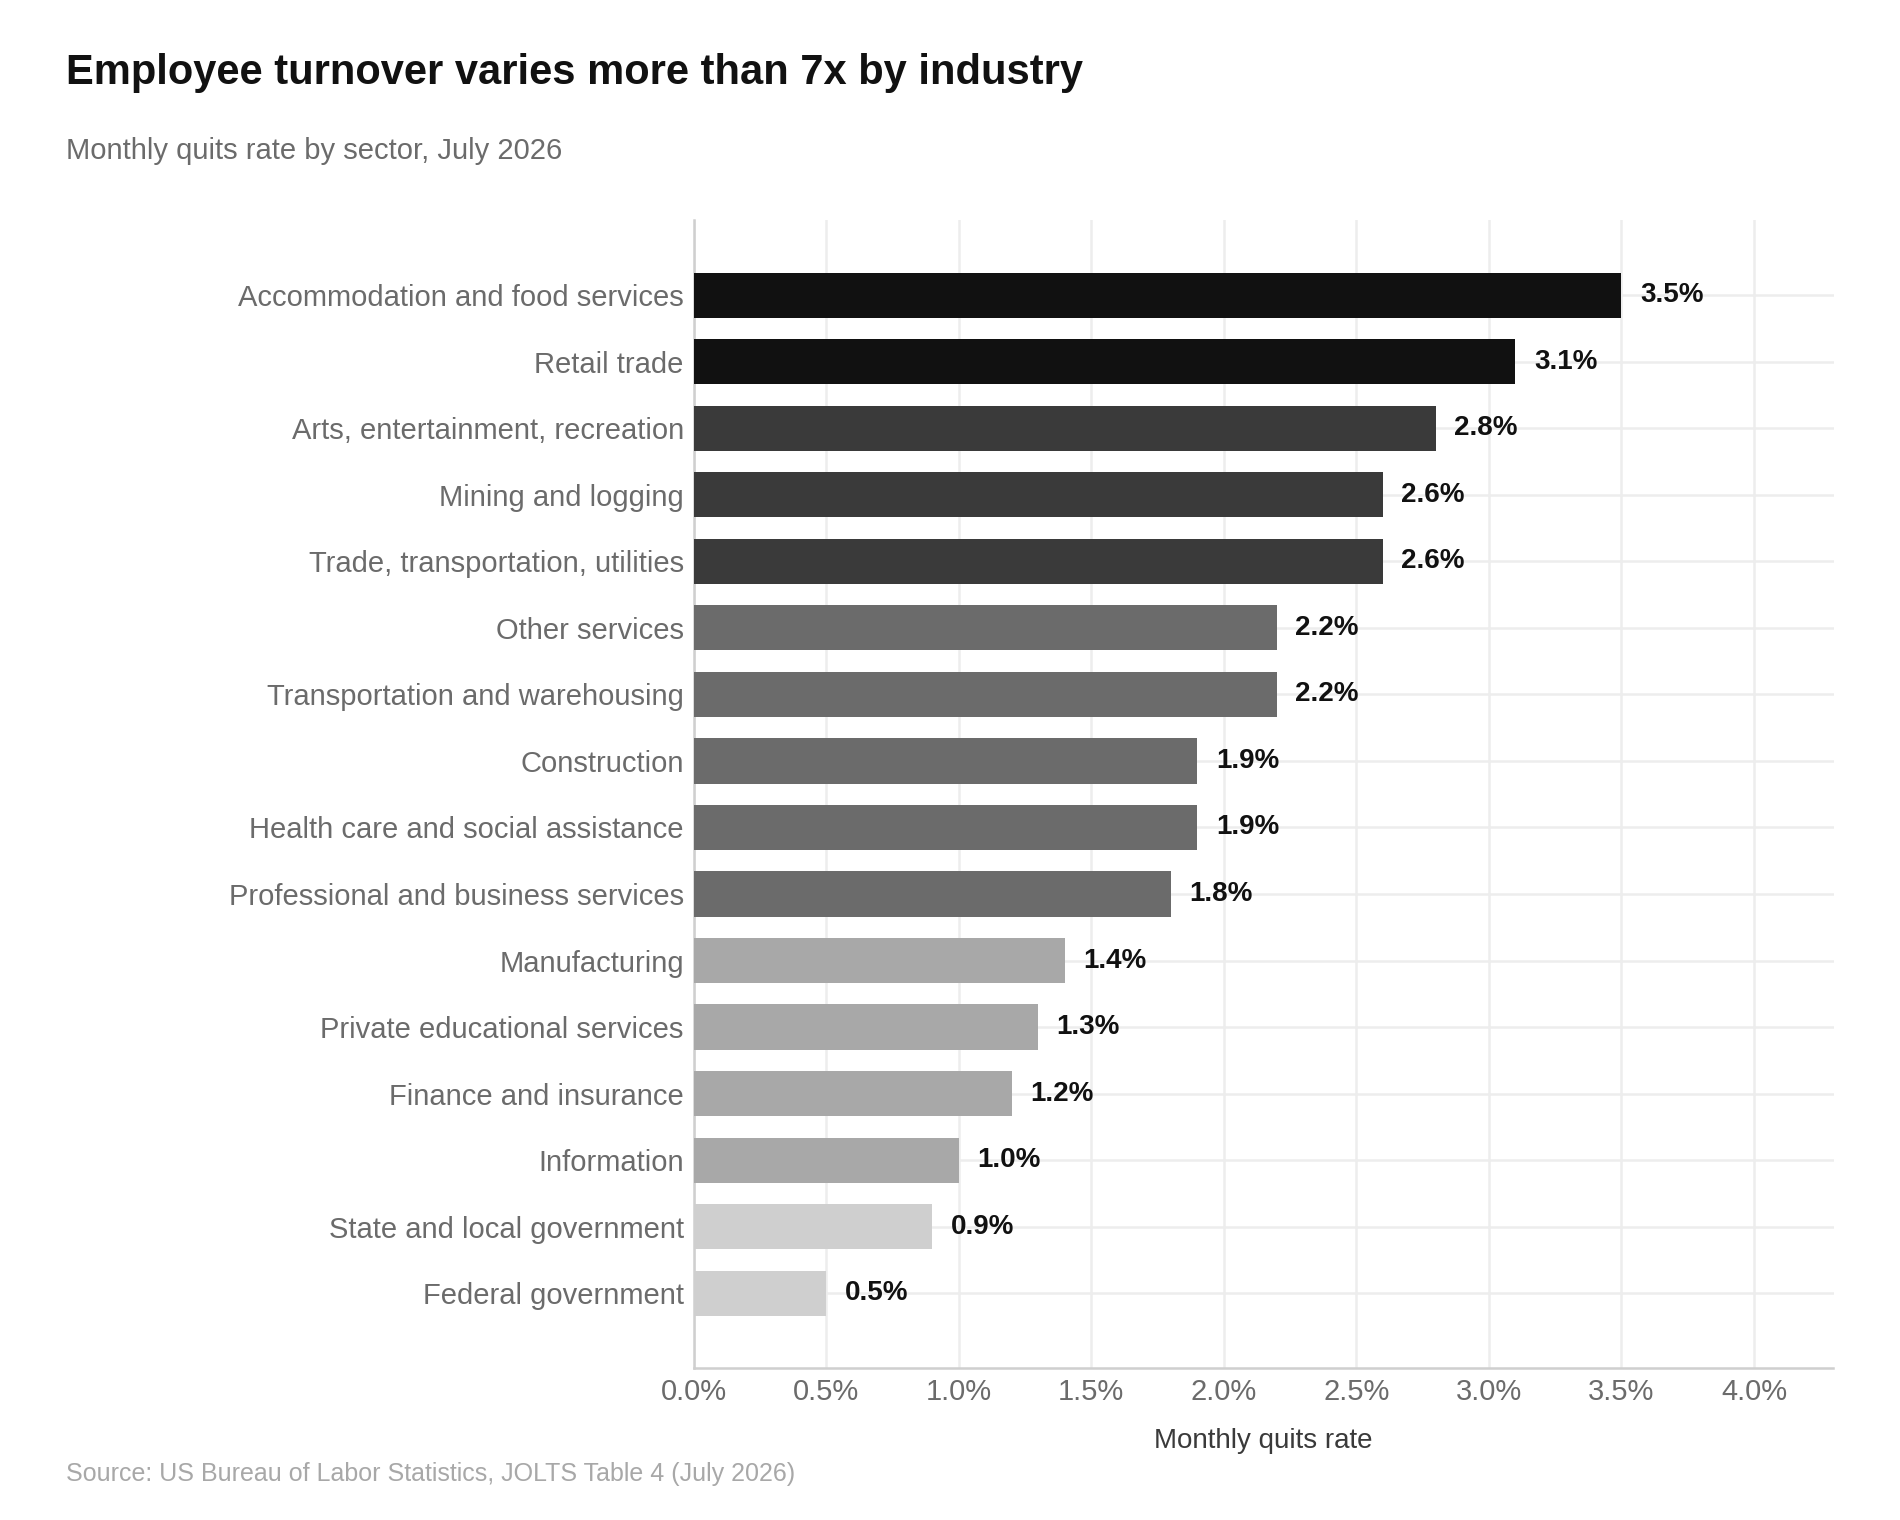
Industry variation is the single biggest driver of what a "normal" turnover rate looks like. The spread runs more than 7x from top to bottom.
| Industry | Quits rate (July 2026) | Approx. annualized |
|---|---|---|
| Accommodation and food services | 3.5% | ~42% |
| Retail trade | 3.1% | ~37% |
| Arts, entertainment, and recreation | 2.8% | ~34% |
| Mining and logging | 2.6% | ~31% |
| Trade, transportation, and utilities | 2.6% | ~31% |
| Other services | 2.2% | ~26% |
| Transportation, warehousing, utilities | 2.2% | ~26% |
| Construction | 1.9% | ~23% |
| Health care and social assistance | 1.9% | ~23% |
| Professional and business services | 1.8% | ~22% |
| Manufacturing | 1.4% | ~17% |
| Private educational services | 1.3% | ~16% |
| Finance and insurance | 1.2% | ~14% |
| Information | 1.0% | ~12% |
| State and local government | 0.9% | ~11% |
| Federal government | 0.5% | ~6% |
Source: BLS JOLTS Table 4
Two shifts stand out year over year.
Professional and business services quits fell from 2.6% in July 2025 to 1.8% in July 2026, a sharp cooling in white-collar mobility.
Retail trade moved the other direction, climbing from 2.3% to 3.1%. Information sits at 1.0%, the lowest private-sector rate on the table, which reflects tech workers staying put while their sector absorbs the heaviest layoff volume.
Firms staffing these roles often compare notes on AI recruiting tools to shorten time to fill when they do need to hire.
Voluntary vs. Involuntary Turnover
The split between the two categories has flipped from the pandemic era.
In July 2026, quits made up roughly 61% of total separations while layoffs and discharges accounted for about 33%, with other separations covering the remaining 7% (Source: BLS).
Broader analyses of full-year data put voluntary turnover at 60% to 70% of all separations in a typical year (Source: Zippia).
The distinction matters for cost modeling. Involuntary turnover carries severance and unemployment insurance exposure but is planned.
Voluntary turnover arrives without warning, hits your highest performers disproportionately, and leaves the role vacant while you scramble.
The Cost of Employee Turnover
This is where the numbers get expensive.
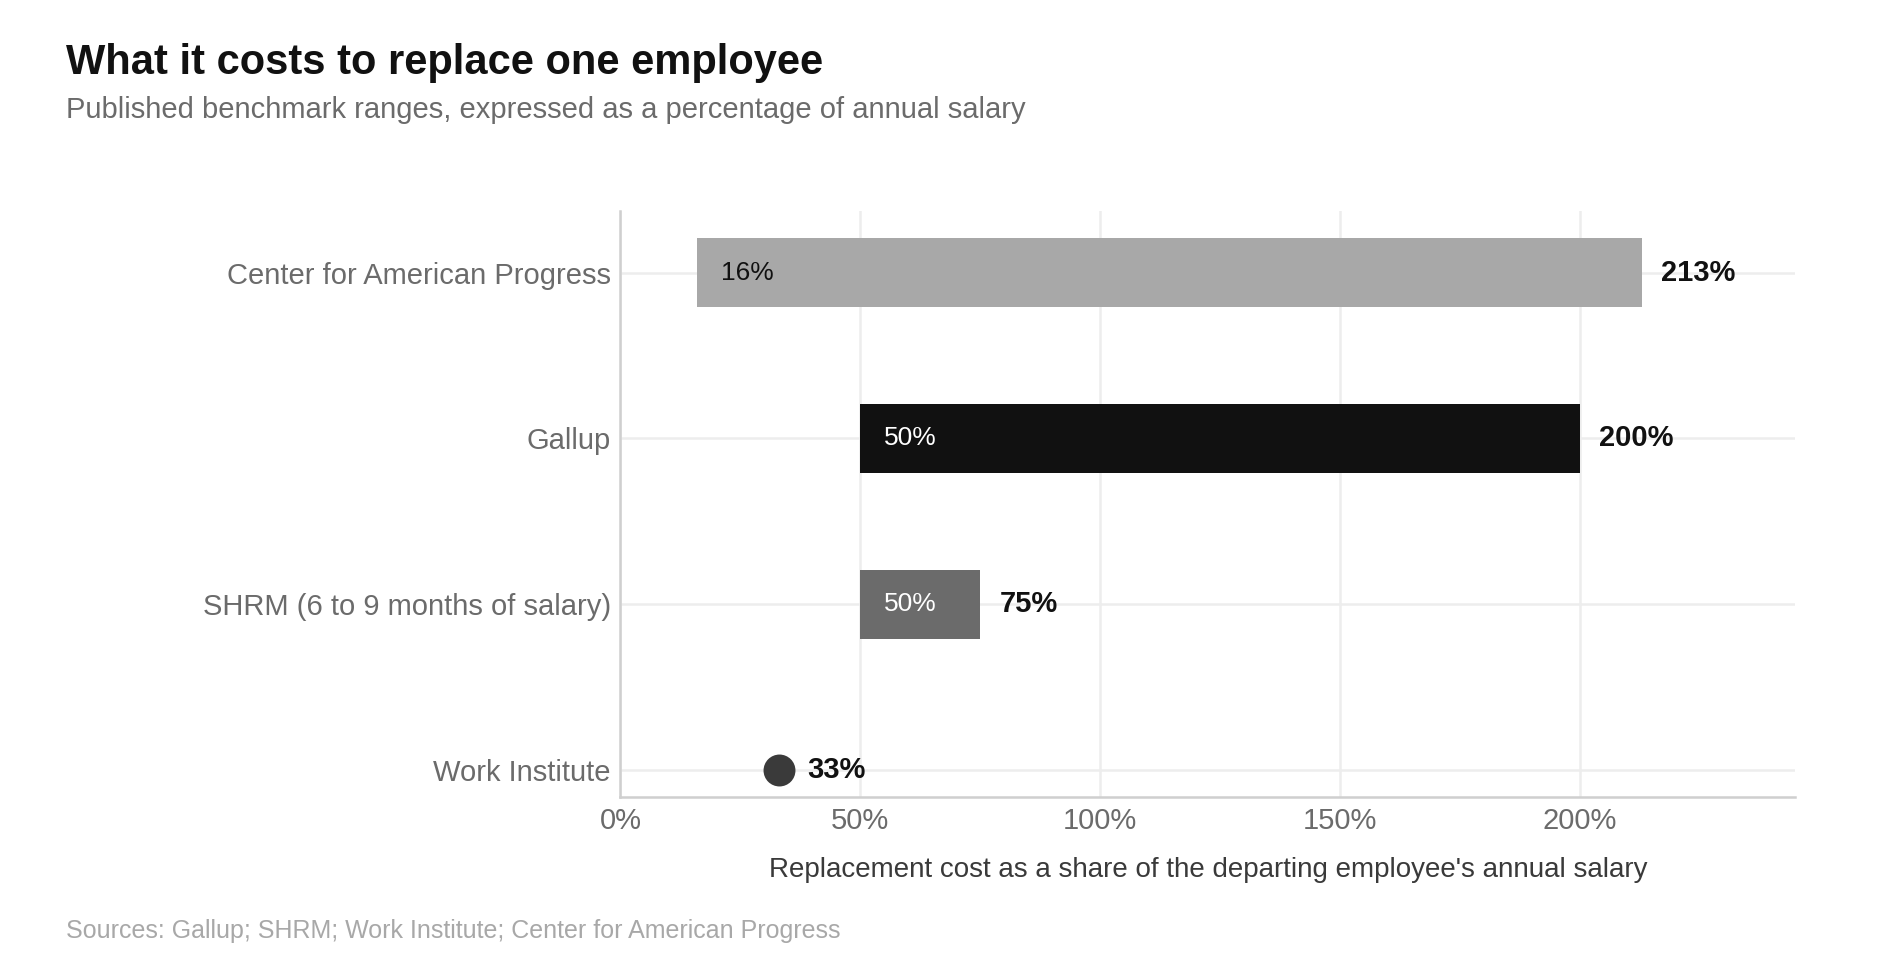
Gallup estimates that replacing an individual employee costs between one-half and two times that person's annual salary, and describes that as a conservative estimate (Source: Gallup).
Aggregate that across the economy and voluntary turnover costs U.S. businesses roughly $1 trillion per year (Source: Gallup).
Other benchmarks converge on the same territory from different angles:
- SHRM has long cited replacement cost at roughly six to nine months of an employee's salary for many roles (Source: BackgroundChecks.com).
- Average direct cost-per-hire sits near $4,700, covering job postings, recruiter time, background checks, and onboarding paperwork (Source: SHRM, via Qooper).
- The Work Institute estimates each departure costs roughly 33% of annual salary, about $15,000 for a worker at the U.S. median wage (Source: Qooper).
- Center for American Progress research places turnover cost near 16% of salary for jobs paying under $30,000 and as high as 213% for executive or highly specialized roles (Source: Manatal).
Direct recruiting spend is the small part. The productivity gap between a departing expert and a ramping replacement is what makes turnover expensive, and it rarely appears on any budget line.
Comparing your figures against average salary by age data helps you model replacement cost against your actual pay bands rather than a generic average.
Turnover Cost by Salary Band
Applying Gallup's 50% to 200% range to common compensation levels produces the following per-departure exposure:
| Annual salary | Cost at 50% | Cost at 100% | Cost at 200% |
|---|---|---|---|
| $40,000 | $20,000 | $40,000 | $80,000 |
| $60,000 | $30,000 | $60,000 | $120,000 |
| $80,000 | $40,000 | $80,000 | $160,000 |
| $100,000 | $50,000 | $100,000 | $200,000 |
| $150,000 | $75,000 | $150,000 | $300,000 |
Gallup's own worked example: a 100-person organization paying an average salary of $50,000 can expect $660,000 to $2.6 million in annual turnover and replacement costs (Source: Gallup).
Scale that to a 10,000-person organization at $75,000 average salary and 13% voluntary turnover, and cutting turnover by just two percentage points saves roughly $11 million a year (Source: Qooper).
Leadership roles sit at the top of the range.
Gallup benchmarks replacement of leaders and managers at approximately 200% of annual salary (Source: Wonderlic).
Why Employees Leave: The Reasons Behind the Numbers
Exit interview data gives the clearest read on causation.
Analysis of 2,888 exit interviews conducted in Q1 2026 found career-related reasons accounted for the largest share of separations at 17.4%, followed by health and family at 13.0%, retirement at 11.9%, and work-life balance at 11.8% (Source: Work Institute).
Management-related turnover represented 8.8% of exits and total rewards accounted for 8.1%.
Two things stand out;
- Career development ranks ahead of pay, consistently, across multiple survey years.
- Compensation, the lever most organizations pull first, explains less than one in twelve departures.
The preventability figure is the one worth putting in front of a CFO. The Work Institute's 2025 Retention Report found that 75% of voluntary exits were preventable (Source: Pin).
Separately, 52% of voluntarily exiting employees say their manager or organization could have done something to stop them from leaving, and 51% report that no leader spoke with them about their job satisfaction in the three months before they left (Source: Gallup).
First-Year and Early-Tenure Turnover
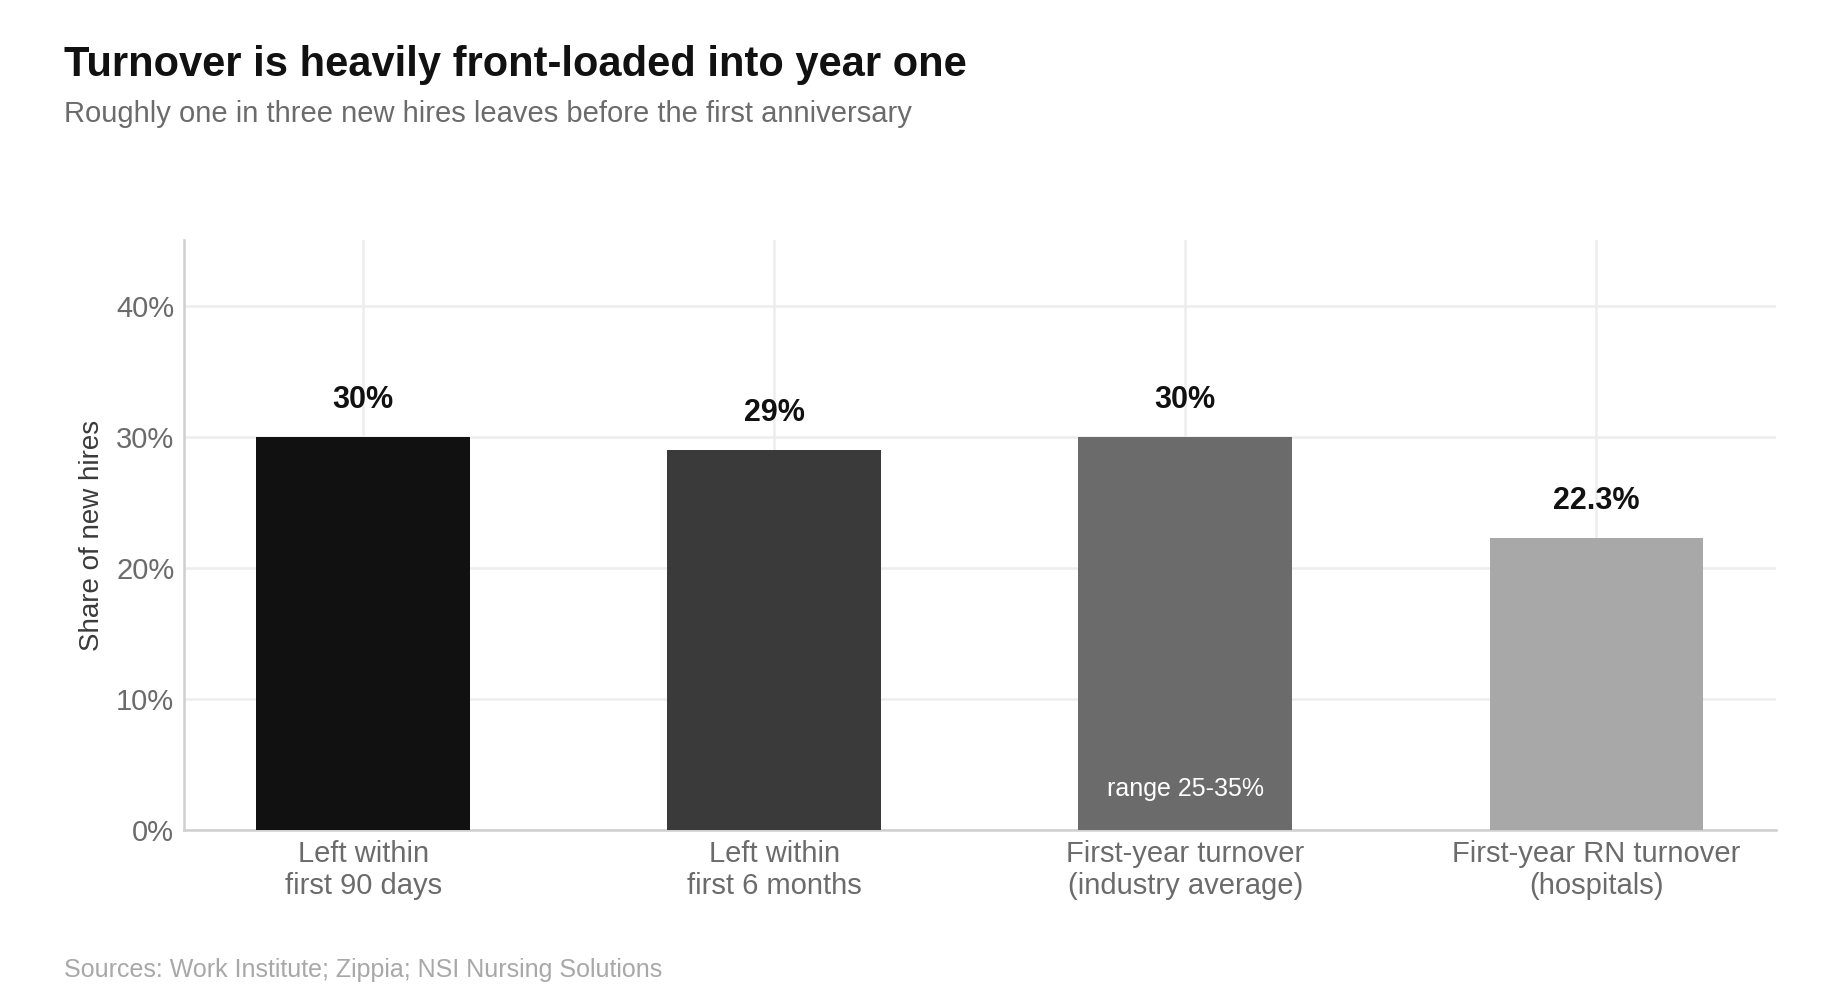
Turnover is heavily front-loaded.
First-year turnover averages 25% to 35% across industries, making the first twelve months the highest-risk retention window (Source: Qooper).
Roughly 29% of employees report quitting within their first six months, and about 30% leave within the first 90 days (Source: Zippia).
Nearly half of those early leavers cite a mismatch between the job as described during interviews and the job as it actually exists.
That is a job description and hiring process problem, not a compensation problem, and it is one of the cheapest categories of turnover to fix.
Organizations running structured onboarding retain 91% of their first-year employees.
Tooling matters here too. Teams standardizing their intake process with applicant tracking systems tend to catch expectation gaps before an offer goes out rather than after.
Healthcare: The Sector With the Best Turnover Data
Healthcare produces the most granular turnover economics of any industry, and the numbers are steep.
The national hospital turnover rate reached 18.5% in 2025, with registered nurse turnover at 17.6%, a 1.2 percentage point increase year over year (Source: NSI Nursing Solutions).
The report covers 527 hospitals across 40 states, 965,886 healthcare workers, and 262,405 registered nurses.
The cost side:
- Average cost of turnover for one staff RN: $60,090 (Source: Becker's Hospital Review).
- Average annual loss per hospital to RN churn: $5.19 million.
- Each single percentage point of RN turnover costs or saves the average hospital $295,000 per year.
- RN vacancy rate: 8.6%, with 33.1% of hospitals reporting vacancy above 10%.
- Average time to recruit an experienced RN: 78 days.
Frontline support roles run far higher than clinical averages, with patient care technicians at 33.8% and certified nursing assistants at 32.5% (Source: The Resource Company).
First-year RN turnover sits at 22.3%, and first-year separations account for 29.0% of all RN turnover at the average hospital.
Engagement, Managers, and Turnover Risk
Engagement is the leading indicator that shows up in turnover data six to twelve months later, and it is deteriorating.
Only 20% of employees worldwide were engaged at work in 2025, down from a 23% peak in 2022 and the lowest reading since 2020 (Source: Gallup).
Gallup estimates low engagement costs the global economy approximately $10 trillion in lost productivity, roughly 9% of global GDP.
The manager layer is where the decline concentrated.
Manager engagement fell from 31% in 2022 to 22% in 2025, including a five-point drop between 2024 and 2025 alone (Source: Sociabble).
Managers have effectively lost the engagement premium they historically held over individual contributors.
That is a turnover problem in waiting, because roughly 70% of the variance in team engagement is attributable to the manager (Source: Qooper).
Meanwhile, 51% of U.S. employees are watching for or actively seeking a new job at any given moment, which is pent-up turnover held in place by a cautious hiring market rather than by satisfaction.
Our employee retention statistics breakdown covers the intervention side of this data in depth.
Turnover by U.S. Region
Geography produces a meaningful spread, though a narrower one than industry.
| Region | Quits rate (July 2026) |
|---|---|
| Midwest | 2.3% |
| South | 2.2% |
| Northeast | 1.5% |
| West | 1.5% |
Source: BLS JOLTS Table 4
The West saw the sharpest single-month move, dropping 0.7 points from June to July 2026, consistent with technology sector contraction concentrated on the coast. The Midwest moved in the opposite direction, up 0.3 points.
How to Benchmark Your Own Turnover Rate
Comparing your number to a national average is close to useless without three adjustments;
- Segment before you compare: Break the rate out by voluntary versus involuntary, then by department, tenure band, and manager. A blended 18% can hide a 40% figure in one function offset by 6% elsewhere.
- Match the denominator: If your benchmark source counts salaried headcount only, do not compare it against a rate that includes seasonal hourly staff.
- Weight by role cost: Losing five entry-level workers at 50% replacement cost and losing one director at 200% are different events with similar headline effects on your percentage. Model the dollars, not just the rate.
Distributed teams need an extra layer, since location and schedule flexibility now function as retention levers.
Our work-from-home statistics and this analysis of remote work technology cover how that plays out.
What the Data Says Actually Reduces Turnover
The intervention research is more consistent than the volume of retention content suggests.
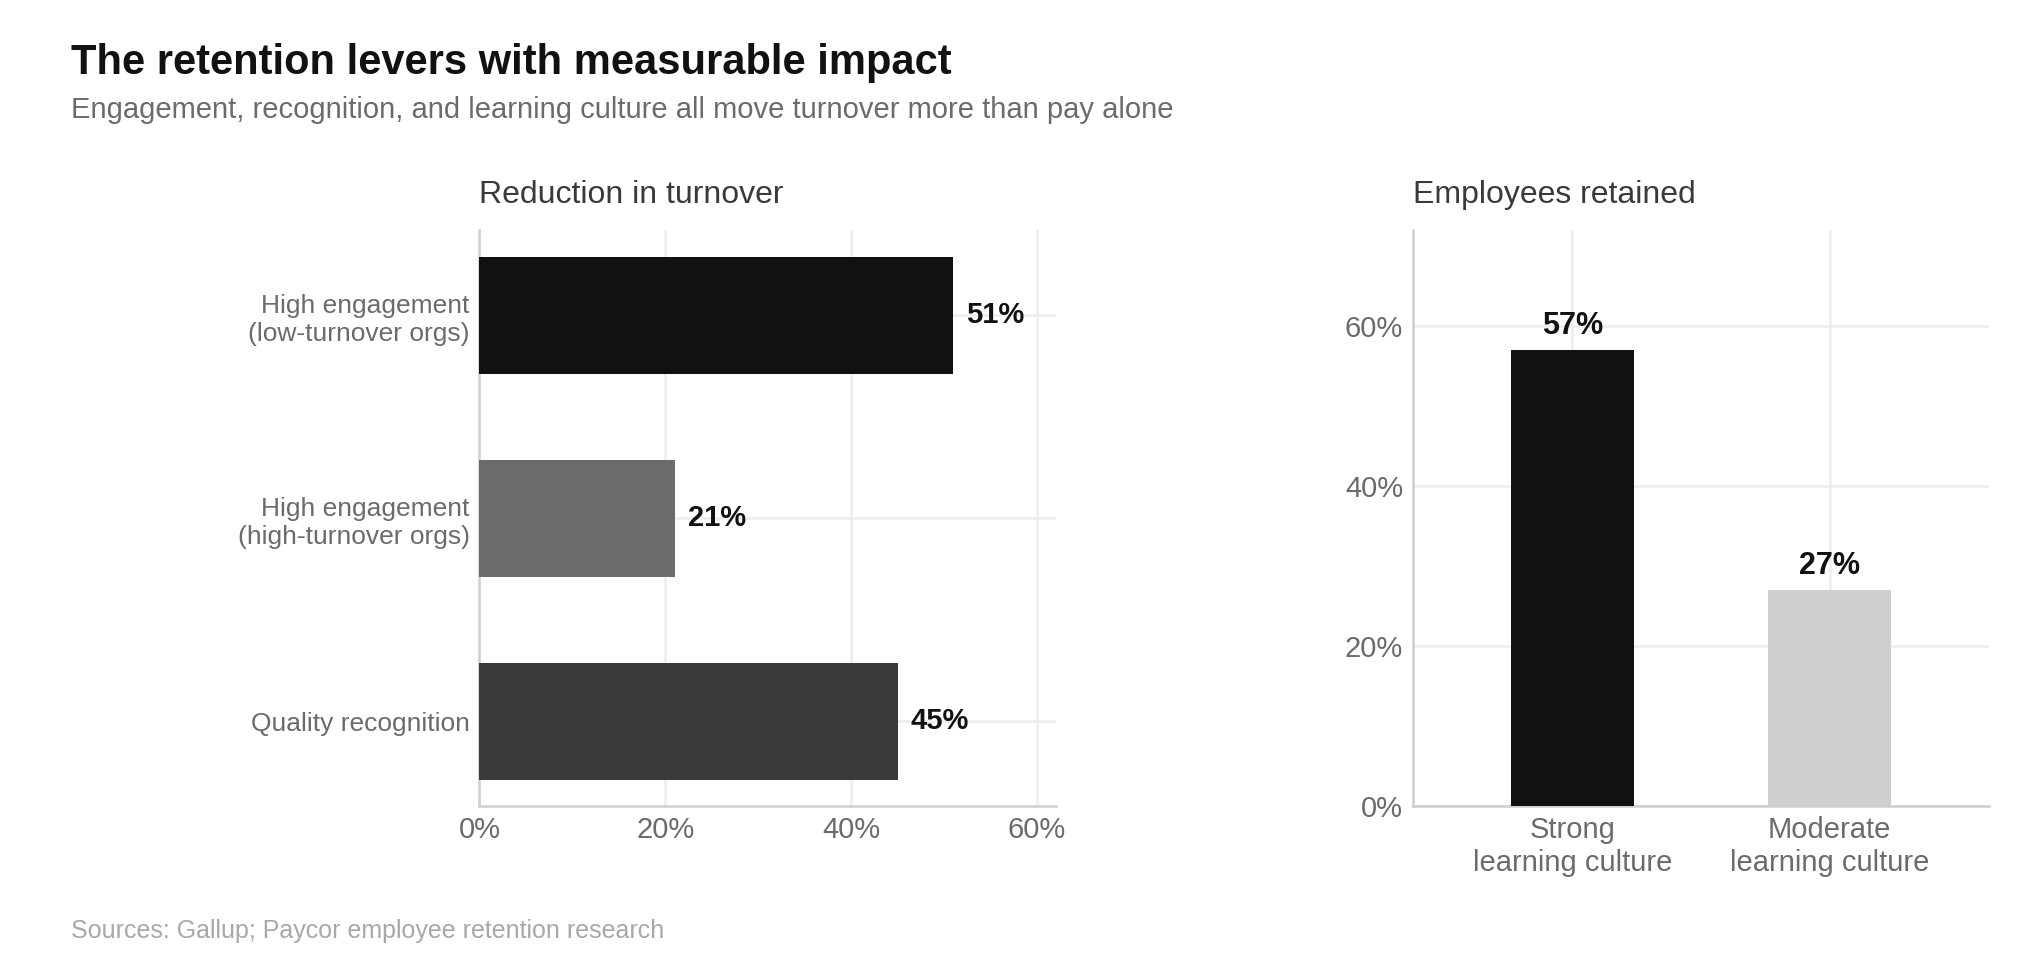
High-engagement organizations record 21% to 51% less turnover than low-engagement peers, with the wider gap appearing in businesses that already run low churn (Source: Paycor).
Strong learning cultures retain 57% of employees compared with 27% at organizations with moderate learning investment, and quality recognition makes employees 45% less likely to leave.
Gallup's framing puts engagement, culture, wellbeing, and work-life balance behind roughly 69% of departures, well ahead of pay in isolation.
The practical order of operations follows the data.
Fix manager quality first, since it explains the largest share of engagement variance.
Build visible advancement paths second, since career reasons lead every exit survey.
Then address compensation, which matters but explains less than most budgets assume.
Teams building the systems layer underneath this often start with employee engagement software or HR software for smaller teams.
Conclusion
B2B Centr puts defensible numbers behind workforce and spend decisions that often rely on instinct.
Employee turnover in 2026 sits at a monthly quits rate of 1.9% and a total separations rate of 3.2%, well below Great Resignation peaks but still expensive enough to represent one of the highest controllable costs in American business at an estimated $1 trillion annually.
Industry variation runs more than 7x from federal government to food service, replacement cost lands between 50% and 200% of salary depending on role, and roughly three quarters of voluntary exits were preventable.
Organizations that treat those figures as a budget line rather than an HR metric will spend less replacing people next year.
Read Next
FAQs
1. What is the average employee turnover rate in 2026?
The average employee turnover rate in 2026 is approximately 3.2% per month in total separations, or roughly 38% annualized across all U.S. sectors, according to BLS JOLTS data. Employer survey benchmarks that exclude seasonal and hourly churn report lower figures, with SHRM placing the all-industries average near 18% annually and Mercer reporting voluntary turnover at 13.0%.
2. How much does employee turnover cost a company?
Employee turnover costs a company between 50% and 200% of the departing employee's annual salary, according to Gallup. For a $60,000 role that means $30,000 to $120,000 per departure, and for leaders and managers the figure reaches roughly 200% of salary. Across the U.S. economy, voluntary turnover costs employers an estimated $1 trillion per year.
3. Which industry has the highest employee turnover rate?
The industry with the highest employee turnover rate is accommodation and food services, at a quits rate of 3.5% per month as of July 2026, or roughly 42% annualized. Retail trade follows at 3.1% monthly, while federal government sits at the low end at 0.5% monthly.
4. What is the number one reason employees quit their jobs?
The number one reason employees quit their jobs is career-related, accounting for 17.4% of separations in Q1 2026 exit interview data from the Work Institute. Health and family reasons follow at 13.0%, retirement at 11.9%, and work-life balance at 11.8%, with total rewards explaining only 8.1% of exits.
5. How do you calculate an employee turnover rate?
You calculate an employee turnover rate by dividing the number of separations during a period by the average headcount during that same period, then multiplying by 100. Segment the result by voluntary versus involuntary, by department, and by tenure band, since a single blended figure typically conceals where the actual retention problem sits.
Disclaimer: This content is provided for informational purposes only and does not constitute legal, financial, or compliance advice. Protocol versions, governance arrangements, and partner counts cited here reflect publicly announced milestones as of August 2026 and are moving quickly. Adoption figures come from vendor and foundation announcements with differing methodologies and should be treated as directional signals rather than guaranteed outcomes.