
Median weekly earnings for the nation's 120.9 million full-time wage and salary workers reached $1,251 in the second quarter of 2026, up 4.6 percent year over year against 3.9 percent inflation (source: U.S. Bureau of Labor Statistics).
B2B Centr tracks compensation, hiring, and payroll benchmarks so operators can build budgets against verified government data instead of vendor estimates. Age remains one of the strongest single predictors of pay in the United States, more predictive than region and second only to education and occupation.
The curve is not a straight line, and the peak arrives earlier than most compensation plans assume.
This report breaks down average salary by age across every band, layered with gender, education, race, and distribution data, so you can benchmark any role against the population it hires from.
Key Takeaways
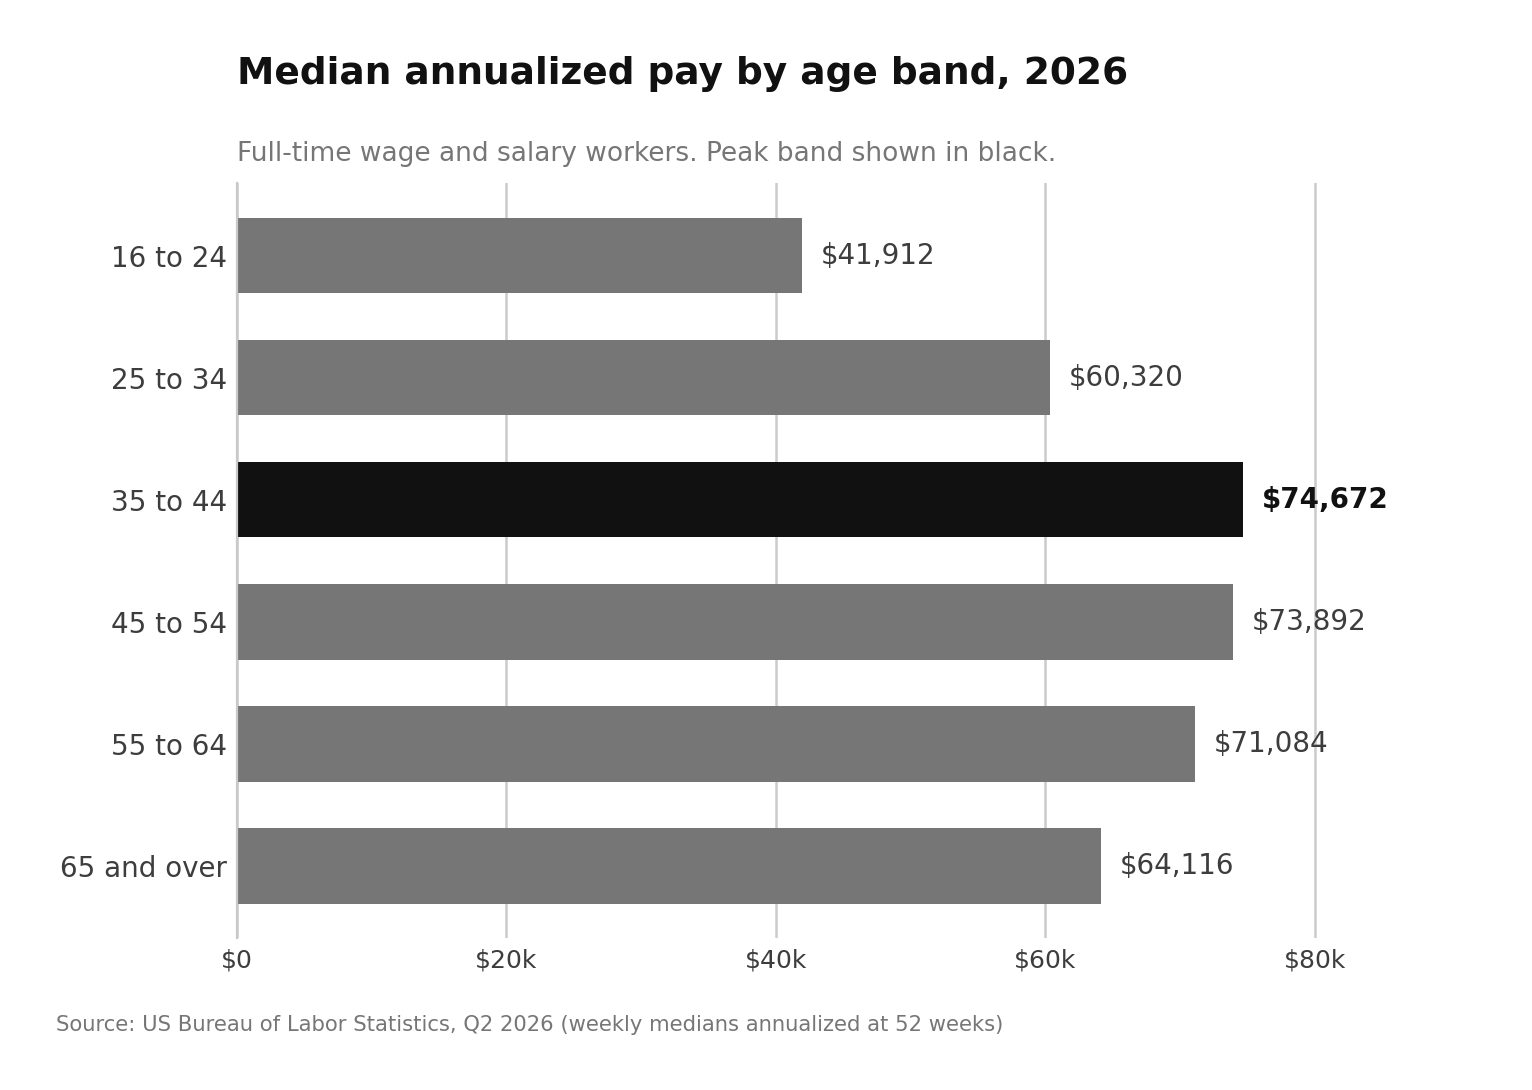
- Median full-time pay peaks at ages 35 to 44, then declines steadily.
- Workers aged 35 to 44 earn $74,672 annualized, 78 percent above the 16 to 24 band.
- The gender pay gap widens sharply after age 34, from 89 percent to 78 percent.
- Earnings fall roughly 14 percent from the age 35 to 44 peak to age 65 plus.
- Education moves the age curve more than any other single variable.
The 2026 Wage Backdrop
Wage growth has cooled from its post-pandemic highs but remains above inflation.
The Atlanta Fed Wage Growth Tracker read 3.8 percent in July 2026, with job changers at 4.4 percent and job stayers at 3.6 percent (source: Federal Reserve Bank of Atlanta).
That 0.8 point spread is the smallest in several years, which means the mobility premium that pushed younger workers up the curve quickly between 2021 and 2023 has thinned considerably.
Real earnings tell a flatter story. Converted to constant 1982 to 1984 dollars, median weekly pay moved from $372 in Q2 2025 to $374 in Q2 2026, a gain of roughly half a percent (source: U.S. Bureau of Labor Statistics).
Nominal raises look healthy on a spreadsheet. Purchasing power has barely moved. Any age-band benchmark you set in 2026 should be read as a nominal figure that inflation is quietly eroding.
For context on how this interacts with total employer cost, our 2026 payroll spending report covers the full loaded-cost picture beyond base salary.
Why Age Predicts Pay So Reliably
Age is a proxy for three things that actually drive compensation: accumulated experience, credential attainment, and occupational sorting. Workers do not get paid more for aging.
They get paid more because by their mid-thirties they have completed degrees, accumulated a decade of tenure, and sorted into higher-paying occupational categories.
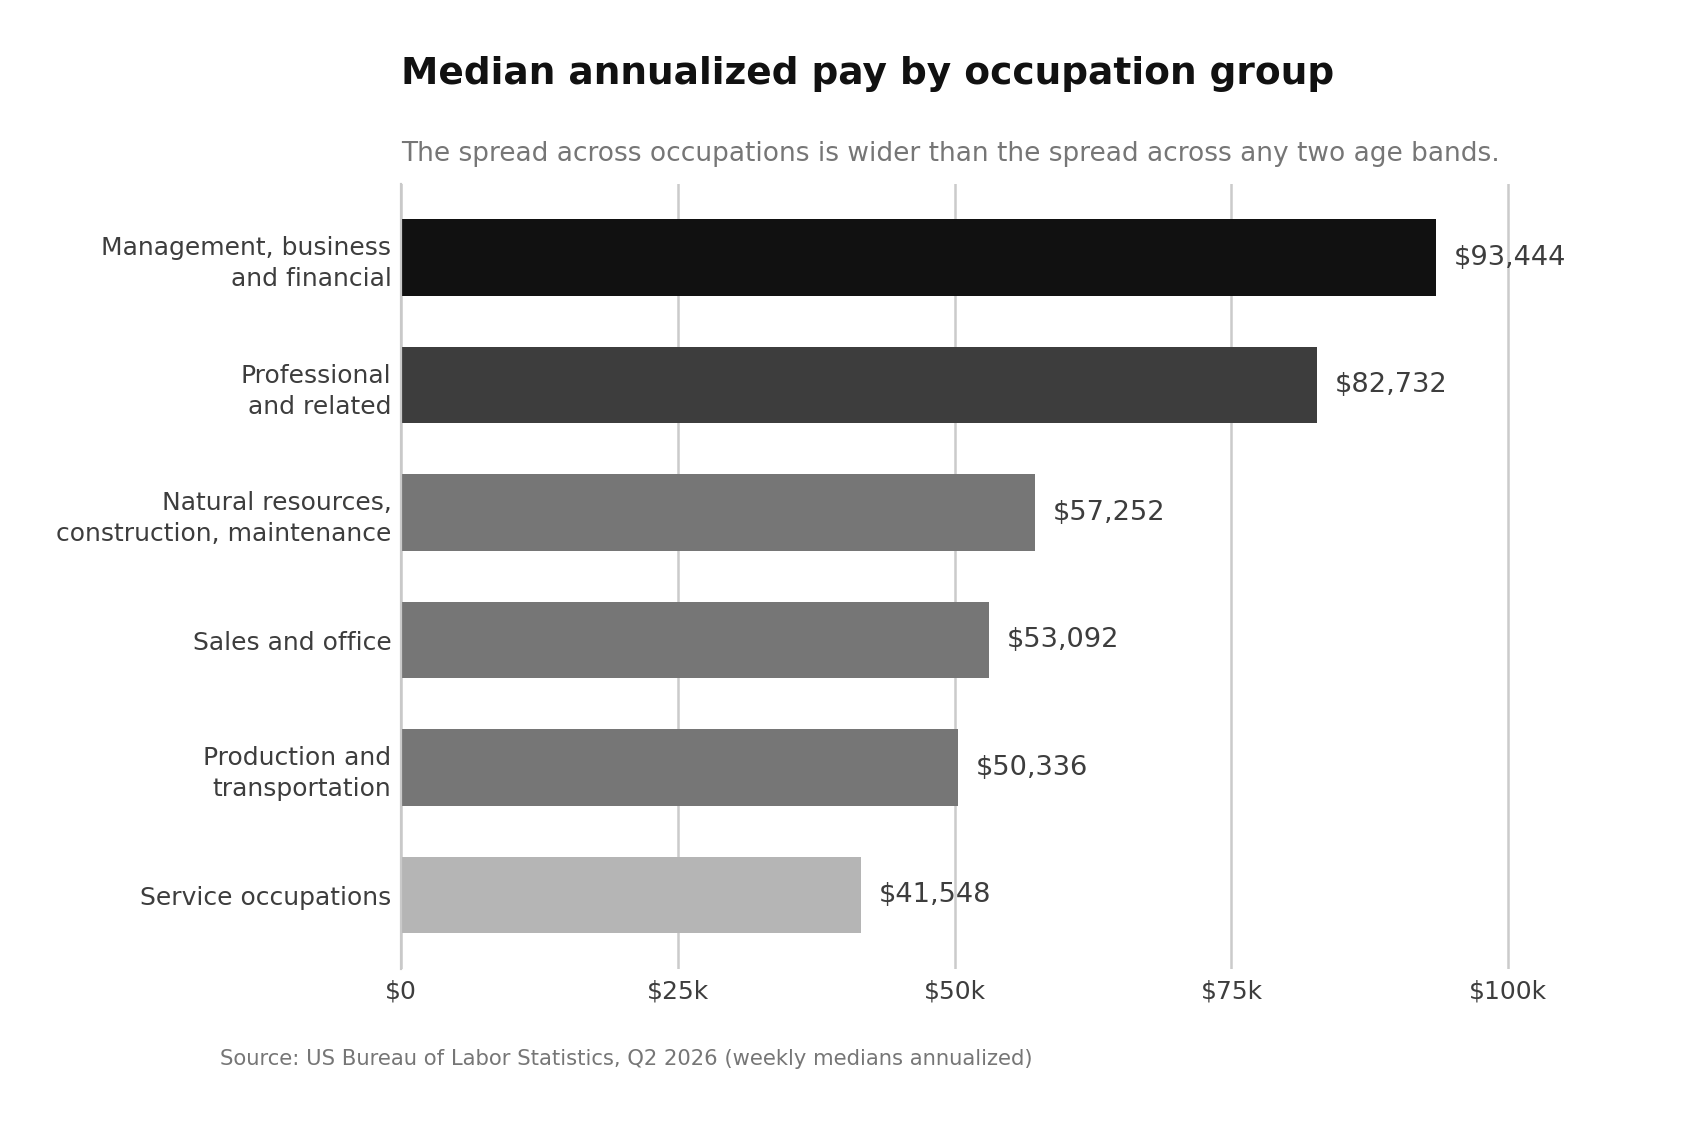
That sorting is visible in the occupation data. Full-time workers in management, professional, and related occupations posted median weekly earnings of $1,697 in Q2 2026, against $799 in service occupations (source: U.S. Bureau of Labor Statistics).
The gap between those two categories is larger than the gap between any two age bands. Age matters because it correlates with which of those categories a worker ends up in, not because seniority itself carries a fixed premium.
This is why age-based salary data works as a market benchmark but fails as a pay-setting mechanism. It tells you what the labor pool at a given life stage costs. It does not tell you what an individual role is worth.
Average Salary by Age: The 2026 Breakdown
The table below annualizes Q2 2026 median weekly earnings across all full-time wage and salary workers. Figures are median, not mean, so they are not inflated by top earners.
| Age Band | Median Weekly | Annualized | Men (Annual) | Women (Annual) |
|---|---|---|---|---|
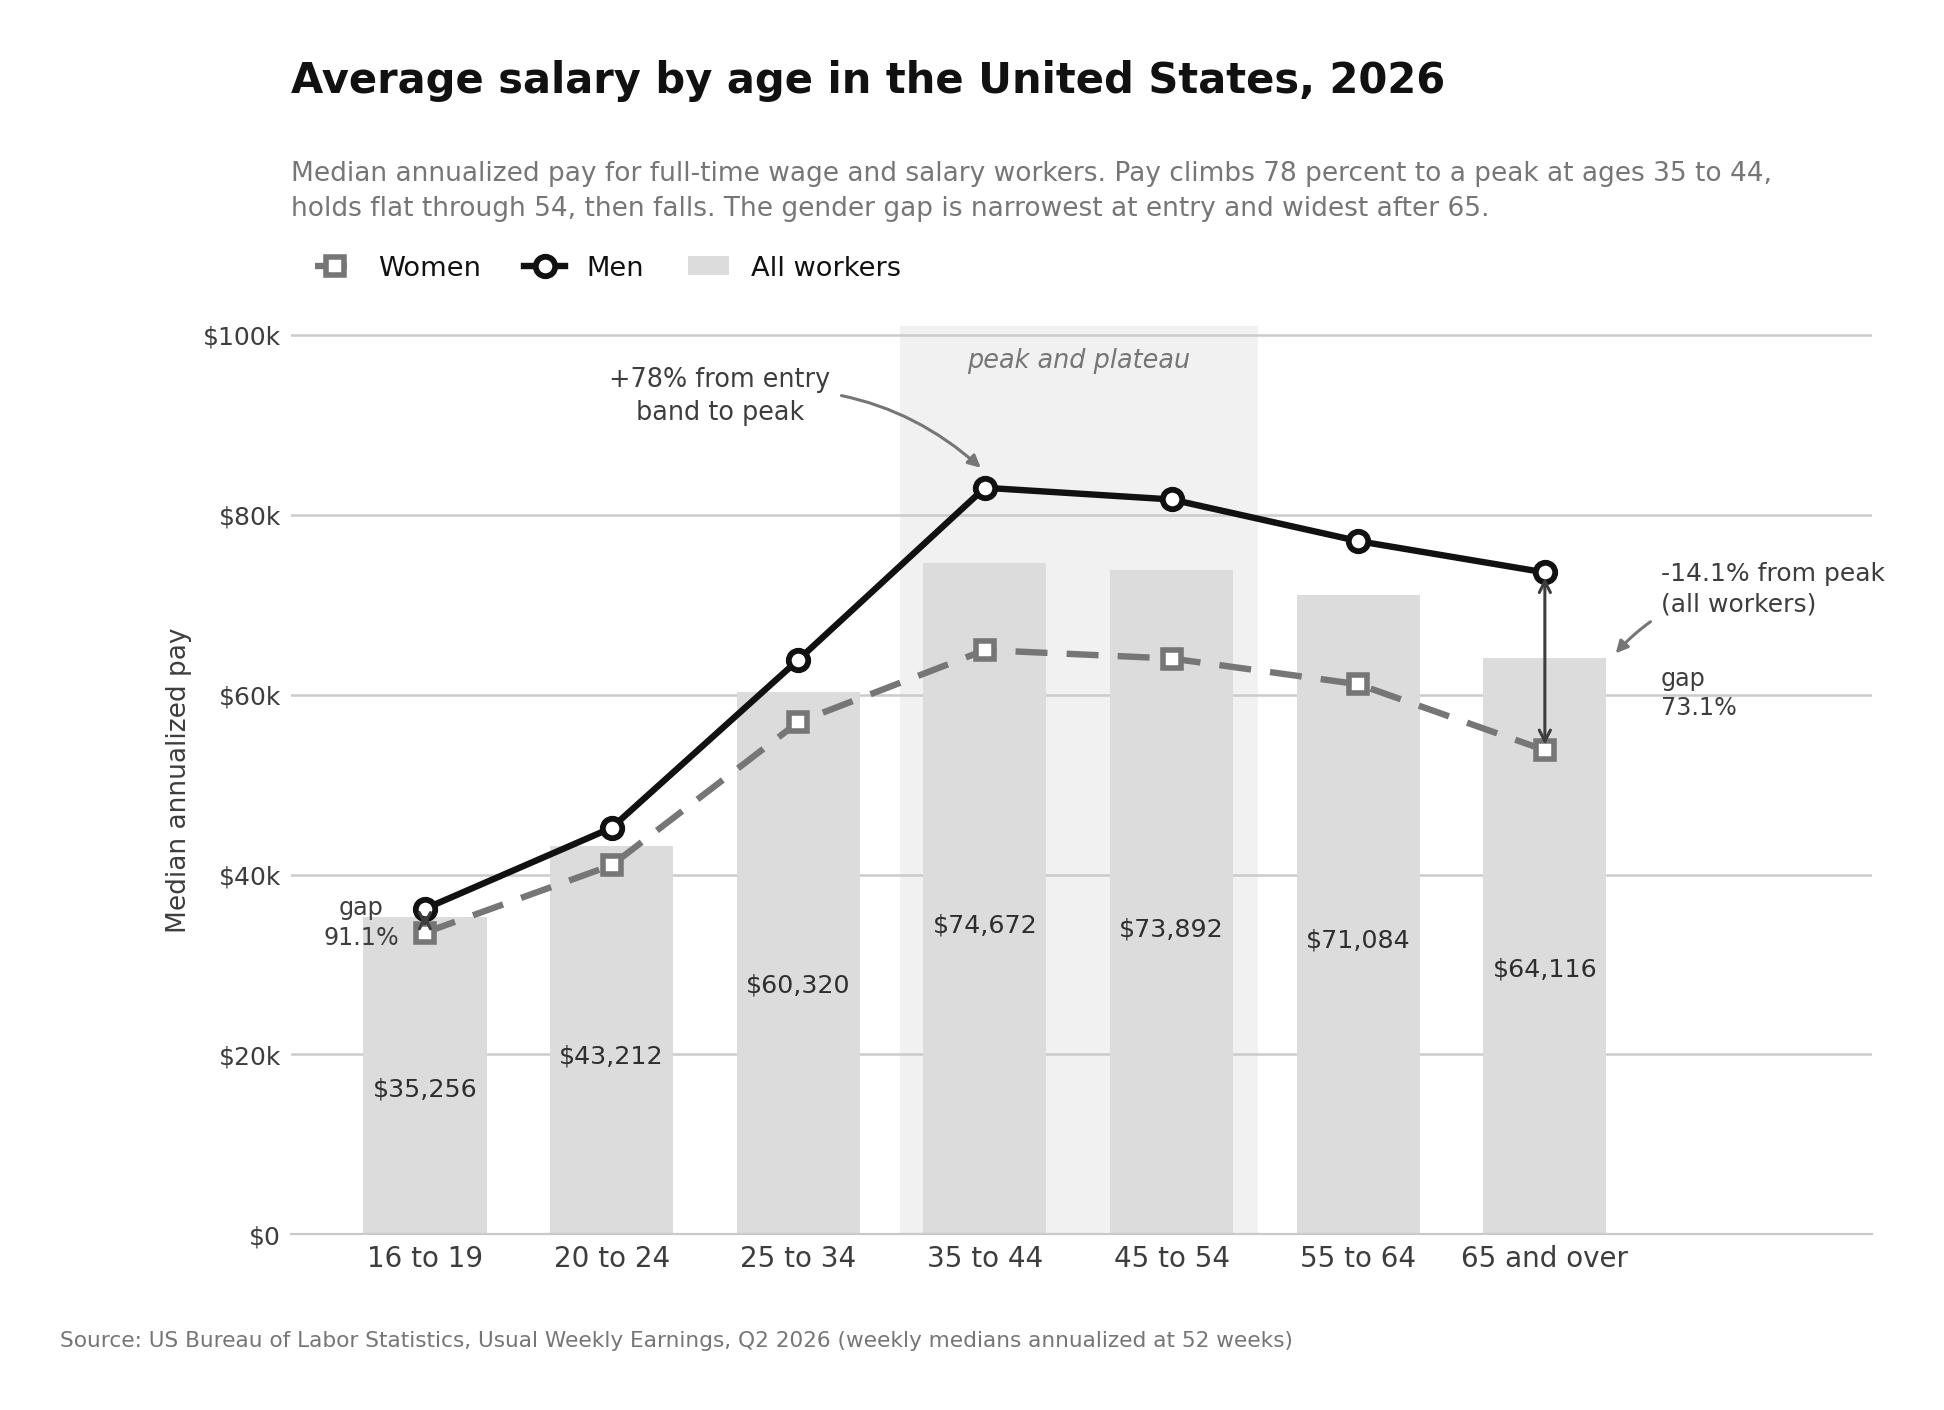
| 16 to 19 | $678 | $35,256 | $36,192 | $33,540 |
| 20 to 24 | $831 | $43,212 | $45,188 | $41,028 |
| 25 to 34 | $1,160 | $60,320 | $63,856 | $56,940 |
| 35 to 44 | $1,436 | $74,672 | $82,992 | $64,948 |
| 45 to 54 | $1,421 | $73,892 | $81,692 | $64,012 |
| 55 to 64 | $1,367 | $71,084 | $77,064 | $61,152 |
| 65 and over | $1,233 | $64,116 | $73,580 | $53,820 |
| All workers 16+ | $1,251 | $65,052 | $71,760 | $58,812 |
All underlying weekly figures are sourced from Table 3 of the Q2 2026 release (source: U.S. Bureau of Labor Statistics). Annualized values assume 52 paid weeks and exclude self-employed workers.
Ages 16 to 24: The Entry Band
Median annualized pay for the full 16 to 24 band is $41,912. The internal split matters: teenagers aged 16 to 19 sit at $35,256, while workers aged 20 to 24 reach $43,212.
That $8,000 jump inside eight years reflects the transition from part-time and hourly retail or service work into first full-time roles.
This band is also where the gender gap is narrowest. Women aged 16 to 24 earn 91.1 percent of what men in the same band earn, the tightest ratio at any life stage (source: U.S. Bureau of Labor Statistics).
Entry-level compensation is standardized, transparent, and rarely negotiated, which compresses variance across every dimension.
Ages 25 to 34: The Steepest Climb
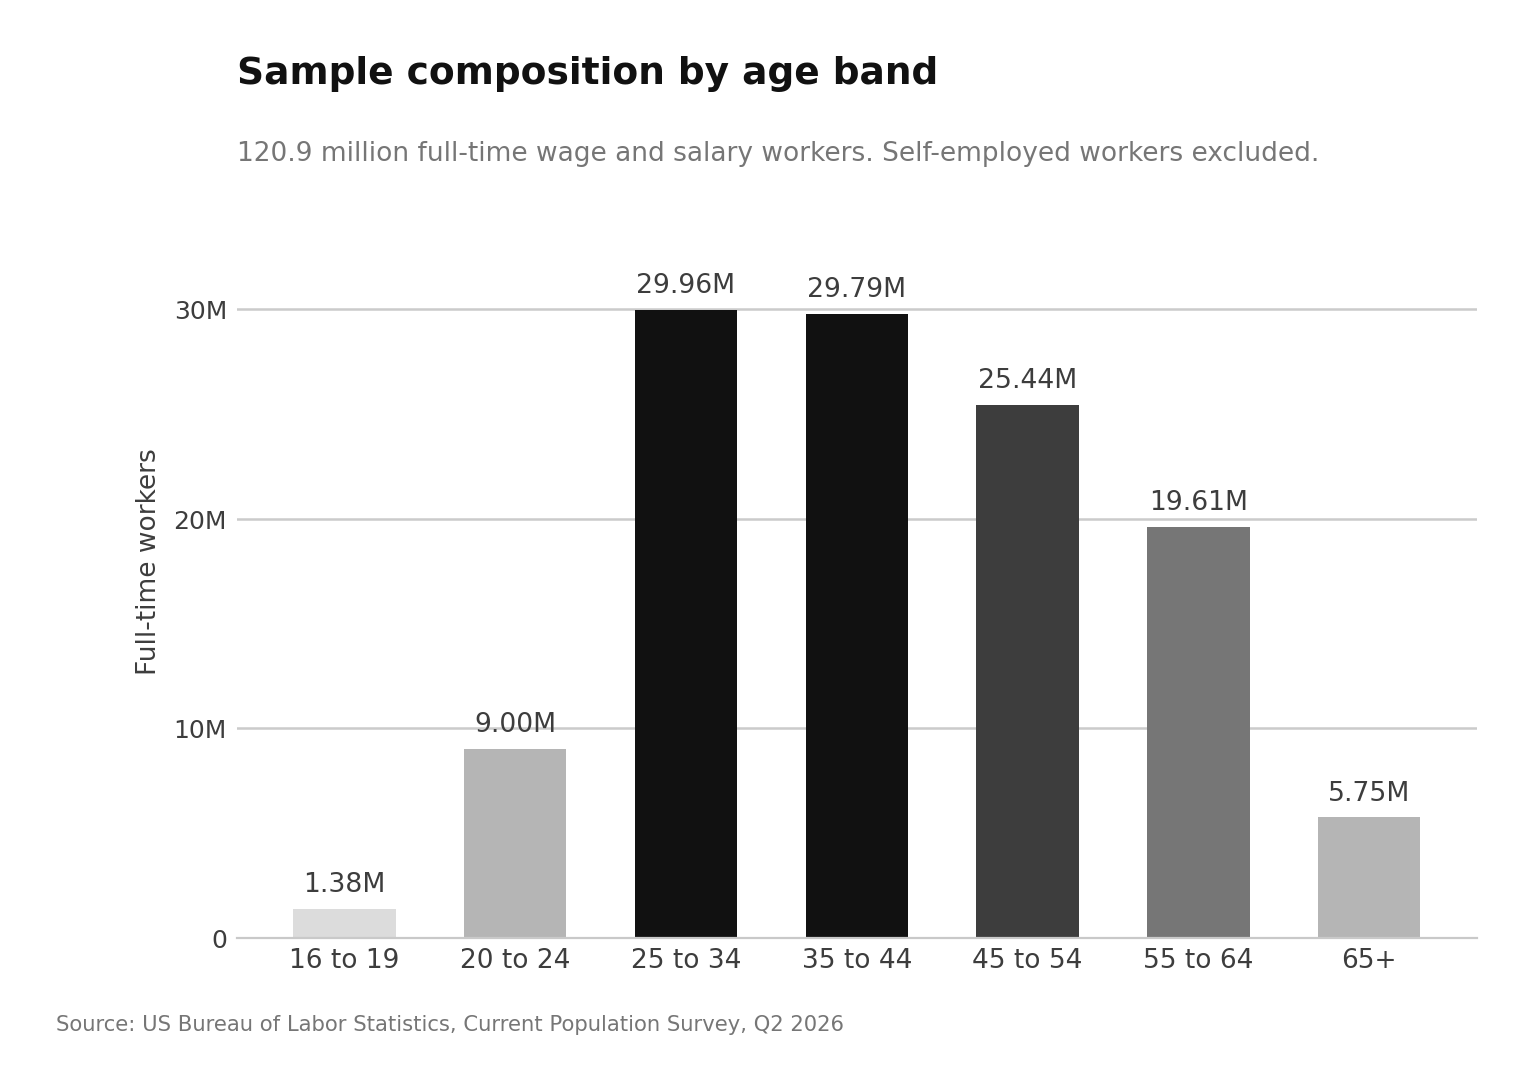
Median annualized pay reaches $60,320. This band contains 29.96 million full-time workers, the largest single cohort in the data.
It is also where the curve moves fastest: earnings rise 43.9 percent from the 16 to 24 band, the largest step change anywhere on the age curve.
Two forces drive that acceleration:
- First, degree completion.
- Second, job mobility.
Younger workers change employers more frequently, and the Atlanta Fed data shows job changers still capturing a 0.8 point premium over stayers.
Our hiring statistics report covers how that mobility pattern is shifting in the current market.
Ages 35 to 44: The Peak
Median annualized pay hits $74,672, the highest of any band. Men in this cohort reach $82,992, the single highest figure in the entire dataset.
The step up from the previous band is 23.8 percent. The step to the next band is negative. That is the central finding of any age-based salary analysis: the peak arrives at roughly age 40, not at 55 or 60 as most seniority-based compensation ladders assume.
Startup and tech compensation bands often peak later, which is worth noting when benchmarking against sector-specific data such as the 2026 startup salaries report or figures from the highest paying tech companies in 2026.
Ages 45 to 54: The Plateau
Median annualized pay is $73,892, down 1.0 percent from the peak. Statistically this is a plateau rather than a decline. Within the margin of error on CPS sampling, the 35 to 44 and 45 to 54 bands are effectively level.
What changes underneath is composition. The share of workers in management occupations continues rising, but so does the share in physically demanding roles where earnings flatten early. The two effects roughly cancel out.
Ages 55 to 64: The First Real Decline
Median annualized pay falls to $71,084, down 3.8 percent from the 45 to 54 band and 4.8 percent from the peak. This is where reduced hours, phased retirement, role changes, and age-related displacement begin to register in aggregate data.
Men in this band earn $77,064 and women earn $61,152, a ratio of 79.4 percent.
Age 65 and Over: The Post-Retirement Wage
Median annualized pay drops to $64,116, a 9.8 percent fall from the 55 to 64 band and 14.1 percent below the peak. Only 5.75 million full-time workers remain in this band, roughly 4.8 percent of the full-time workforce.
The gender gap is widest here. Women aged 65 and over earn $53,820 against $73,580 for men, a ratio of 73.1 percent. Cumulative career interruptions compound across four decades and show up most starkly at the end of the curve.
Average Salary by Age and Gender
The gender pay gap is not constant across the age curve. It opens at a specific point and never fully closes.
| Age Band | Women's Earnings as % of Men's |
|---|---|
| 16 to 24 | 91.1% |
| 25 to 34 | 89.2% |
| 35 to 44 | 78.3% |
| 45 to 54 | 78.4% |
| 55 to 64 | 79.4% |
| 65 and over | 73.1% |
The break occurs between ages 34 and 35, where the ratio drops nearly 11 points in a single band transition.
Across the full workforce, women earned 82.0 percent of the male median in Q2 2026 (source: U.S. Bureau of Labor Statistics).
Census Bureau data for full-time year-round workers put the annual ratio at 80.9 percent in 2024, down from 82.7 percent the prior year (source: U.S. Census Bureau).
How Education Reshapes the Age Curve
Education produces larger swings than age does. Among full-time workers aged 25 and over:
| Attainment | Median Weekly | Annualized |
|---|---|---|
| Less than high school | $803 | $41,756 |
| High school, no college | $994 | $51,688 |
| Some college or associate | $1,125 | $58,500 |
| Bachelor's degree only | $1,628 | $84,656 |
| Advanced degree | $1,963 | $102,076 |
Source: U.S. Bureau of Labor Statistics.
The spread from no diploma to advanced degree is $60,320 annualized, larger than the entire age curve from entry to peak.
A 28-year-old with a master's degree out-earns the median 45-year-old comfortably. When you benchmark by age alone, you are averaging across attainment levels that differ by more than double.
Average Salary by Age and Race or Ethnicity
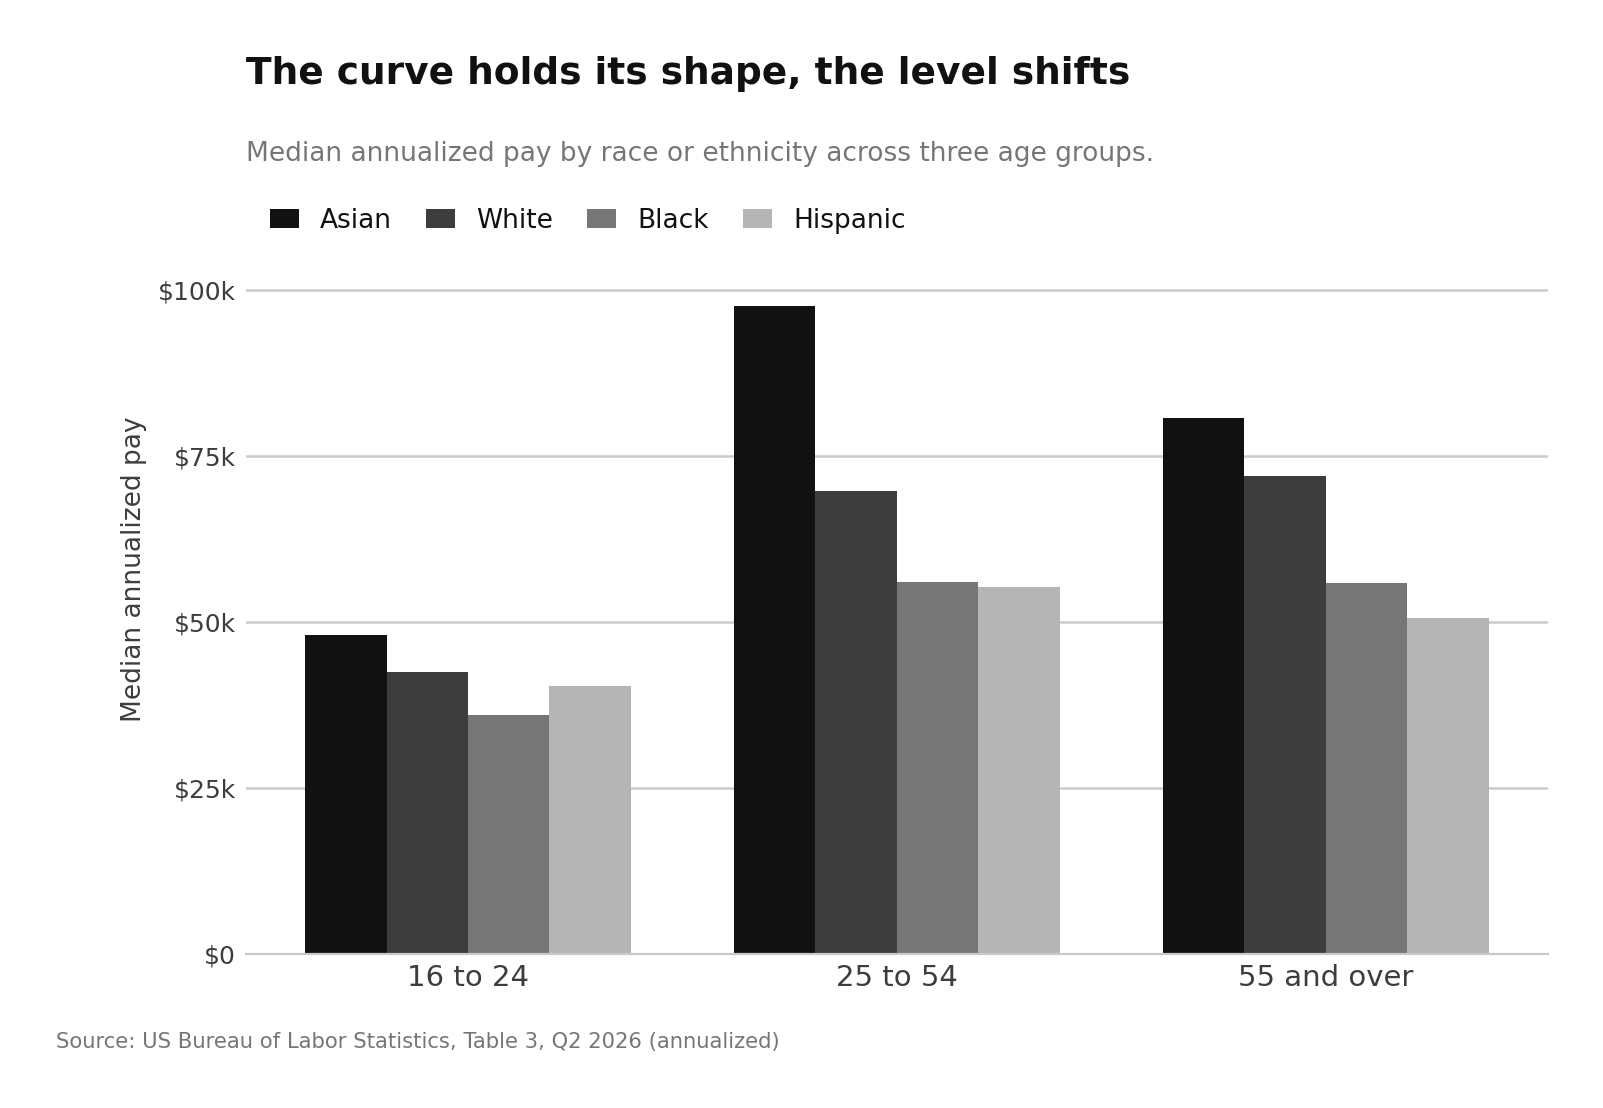
Cross-cutting age with race and ethnicity shows that the shape of the curve holds while the level shifts. Annualized medians for the prime working band, ages 25 to 54:
| Group | Weekly (25 to 54) | Annualized |
|---|---|---|
| Asian | $1,876 | $97,552 |
| White | $1,342 | $69,784 |
| Black or African American | $1,079 | $56,108 |
| Hispanic or Latino | $1,062 | $55,224 |
Source: U.S. Bureau of Labor Statistics.
At entry level the gaps are narrower: $924 weekly for Asian workers aged 16 to 24 against $691 for Black workers in the same band. The divergence widens through the prime working years, mirroring the pattern seen in the gender data.
What the Median Hides
Medians describe the midpoint, not the range. The Q2 2026 distribution across all full-time workers:
- 10th percentile: $642 weekly, $33,384 annualized
- 25th percentile: $850 weekly, $44,200 annualized
- Median: $1,251 weekly, $65,052 annualized
- 75th percentile: $1,915 weekly, $99,580 annualized
- 90th percentile: $2,924 weekly, $152,048 annualized
Source: U.S. Bureau of Labor Statistics.
The 90th percentile earns 4.6 times the 10th. Among men with advanced degrees, the top 10 percent earn $5,363 or more per week, roughly $278,876 annualized.
For a broader reference on aggregate wage levels, the national average wage index reached $69,846.57 for 2024 (source: Social Security Administration), which sits above the population median because averages are pulled upward by top earners.
What Drives the Peak-and-Plateau Shape
Four mechanisms explain why earnings stop climbing around age 40:
- Skill obsolescence. Technical skills acquired early depreciate. Workers who do not retrain see real wages flatten even as nominal pay ticks up.
- Occupational ceilings. Most roles have a top of band. Once a worker reaches it, further increases track inflation rather than performance.
- Hours reduction. Full-time status requires 35 hours minimum. Workers reducing from 50 hours to 38 stay classified as full-time while weekly earnings fall.
- Cohort effects. Older workers entered the labor market under different wage structures. Part of the observed decline is a generational comparison rather than an individual trajectory.
That last point is important and frequently missed. The data compares a 60-year-old today with a 40-year-old today. It does not track the same person over twenty years.
How to Use Age-Based Salary Data
For compensation planning, age bands work as a market floor check, not a pay-setting input. Three practical applications:
- Budget forecasting. If your hiring plan skews toward the 25 to 34 band, your median loaded cost per hire sits near $60,320 in base pay before benefits and employer taxes. Skew toward 35 to 44 and that base rises roughly 24 percent.
- Retention modeling. The flat stretch between 35 and 54 means internal raises in that range are competing against a market that is not moving much. Modest increases retain effectively.
- Role benchmarking. For specific functions, occupation-level data beats age data. Our breakdowns of B2B account executive cost and SDR cost provide function-specific figures. Location flexibility also shifts the calculation, covered in our work from home statistics.
Teams building this into a systematic process should pair the benchmark data with proper tooling. Reference points on that spend are available in the 2026 HR tech spending report.
Methodology and Limitations
All primary figures come from the Current Population Survey, a monthly household survey of roughly 60,000 eligible households conducted by the Census Bureau for BLS. Earnings data covers one quarter of the monthly sample and excludes all self-employed workers, both incorporated and unincorporated (source: U.S. Bureau of Labor Statistics).
Four limitations apply:
- Annualized figures assume 52 paid weeks and will overstate earnings for workers with unpaid leave.
- Excluding the self-employed removes a meaningful share of high earners in the 45 plus bands.
- CPS sampling carries confidence intervals, so single-point differences under roughly 2 percent should be treated as noise.
- Data for October 2025 was not collected due to the federal government shutdown, which affects some year-over-year comparisons in the annual series (source: U.S. Bureau of Labor Statistics).
Conclusion
B2B Centr publishes compensation and payroll benchmarks built from primary government data so operators can plan against numbers they can verify.
Average salary by age in 2026 follows a consistent shape: a fast climb from $41,912 in the 16 to 24 band to a peak of $74,672 at ages 35 to 44, a flat stretch through 54, then a steady decline to $64,116 for workers aged 65 and over.
Gender gaps stay narrow through the twenties and widen sharply after 34.
Education moves the curve more than age does.
Used correctly, these bands establish what the labor pool at each life stage costs.
Used as a pay-setting rule, they mislead.
Read Next
FAQs
1. What is the average salary by age in the United States in 2026?
The average salary by age in the United States in 2026 ranges from $41,912 annualized for workers aged 16 to 24 up to a peak of $74,672 for workers aged 35 to 44, before declining to $64,116 for workers aged 65 and over, based on Q2 2026 median weekly earnings.
2. At what age do salaries peak in 2026?
Salaries peak at ages 35 to 44 in 2026, where median annualized full-time earnings reach $74,672. Earnings then plateau through age 54 and decline steadily after 55.
3. How much does the average 30 year old earn in 2026?
The average 30 year old earns approximately $60,320 annualized in 2026, based on the median weekly earnings of $1,160 for full-time workers aged 25 to 34.
4. Why does the gender pay gap widen with age?
The gender pay gap widens with age because career interruptions, occupational sorting, and negotiated pay differences compound over time. Women earn 91.1 percent of male earnings at ages 16 to 24 but only 73.1 percent at age 65 and over.
5. Is age or education a stronger predictor of salary?
Education is a stronger predictor of salary than age. The gap between workers with no high school diploma and those with advanced degrees is $60,320 annualized, larger than the entire climb from entry-level pay to the age 35 to 44 peak.
Disclaimer: This content is provided for informational purposes only and does not constitute legal, financial, or compliance advice. Protocol versions, governance arrangements, and partner counts cited here reflect publicly announced milestones as of August 2026 and are moving quickly. Adoption figures come from vendor and foundation announcements with differing methodologies and should be treated as directional signals rather than guaranteed outcomes.