
In June 2026, 52.5% of workers in financial activities teleworked or worked at home for pay, the highest share of any major US industry (source: U.S. Bureau of Labor Statistics).
B2Bcentr helps organizations design, staff, and manage distributed work models using verified labor market data rather than headlines.
Work from home has stopped expanding and stopped collapsing, settling instead into a stable structure that varies sharply by industry, role, age, and country.
The gap between what workers do and what employers advertise has become the defining tension of 2026.
This report breaks down the current work from home statistics across adoption, demographics, salaries, productivity, hiring, and global benchmarks.
Key Takeaways
- 22.6% of US workers teleworked in March 2026, flat for three years.
- Roughly 27% of all US paid workdays are now performed from home.
- Hybrid dominates: 52% of remote-capable US employees split home and office.
- Only 3% of new Q2 2026 US job postings were fully remote.
- Hybrid work cut quit rates by 33% with no performance loss.
The Work From Home Market in 2026
Work from home is no longer a trend line moving in one direction.
It is a plateau.
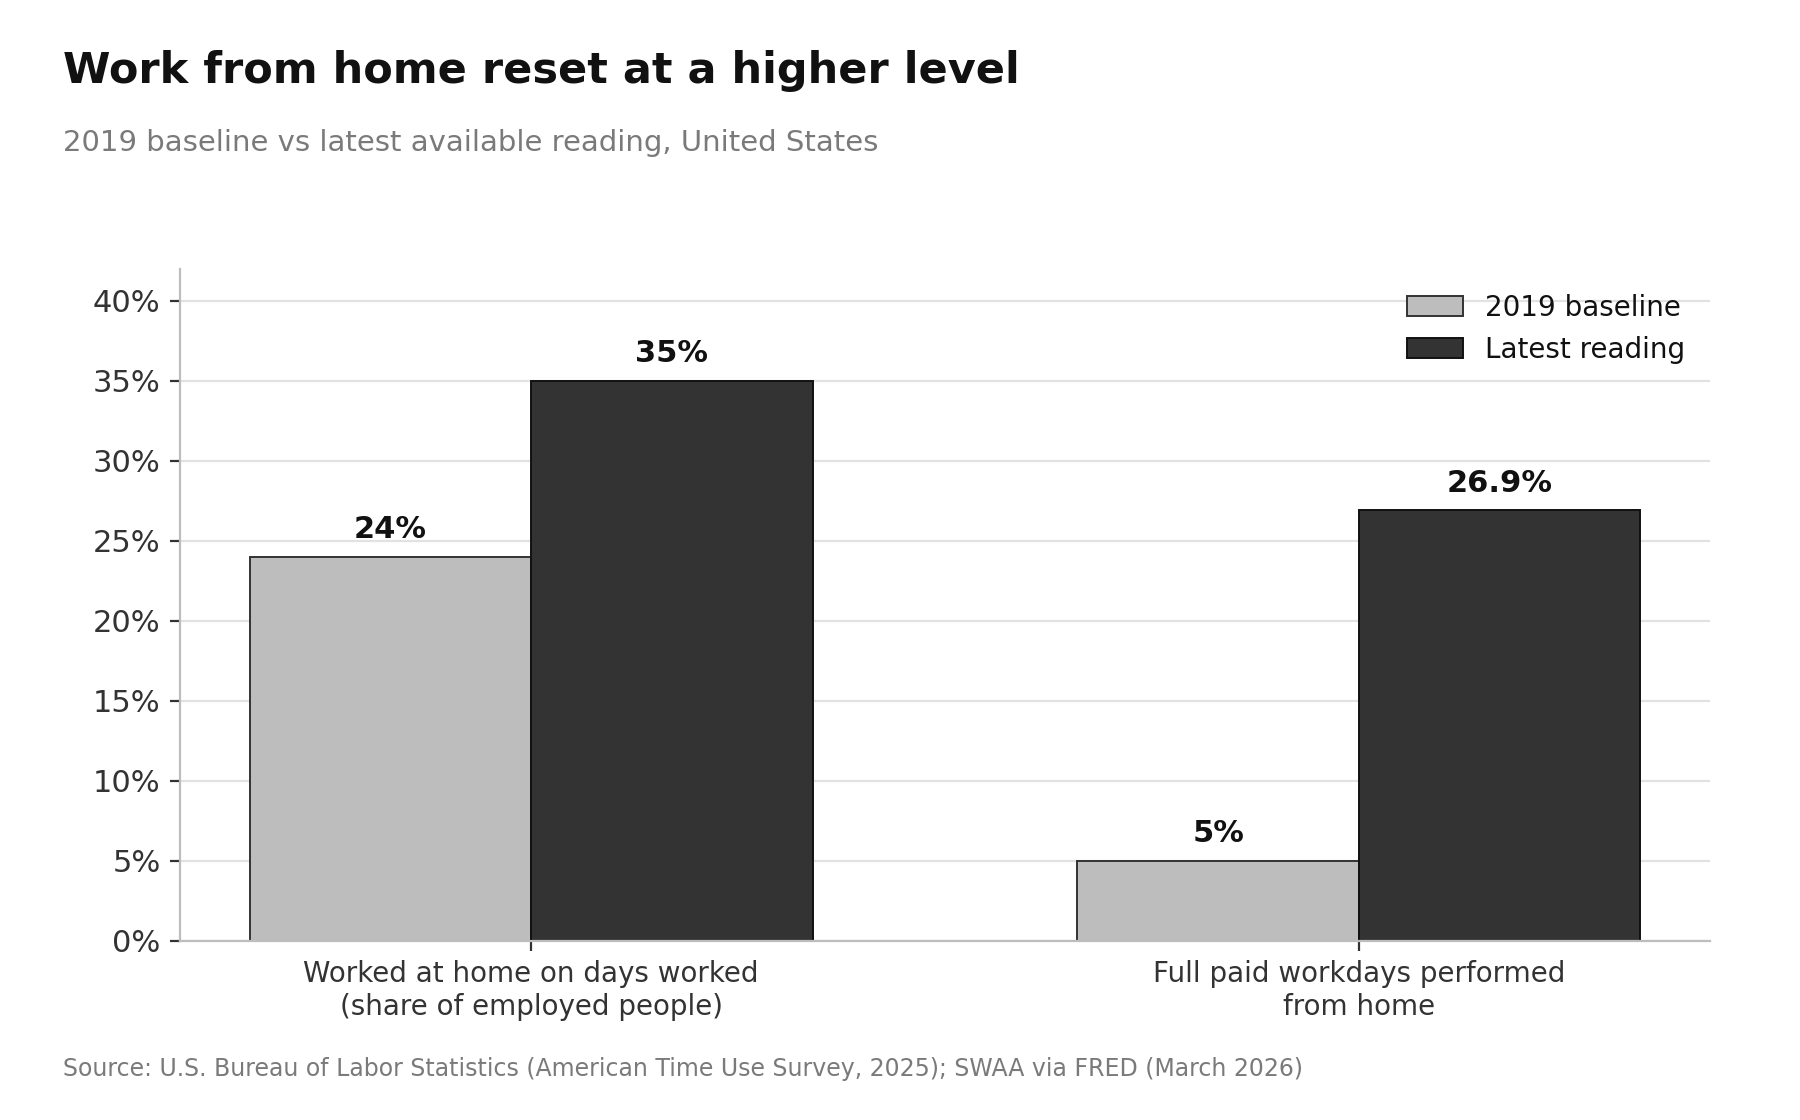
Roughly 26.9% of full paid working days in the United States were worked from home in March 2026, compared with a pre-pandemic baseline near 5% (source: FRED, Federal Reserve Bank of St. Louis).
That is a five-fold structural increase that has now held for four consecutive years.
The broader time-use picture confirms it. In 2025, 35% of employed people did some or all of their work at home on days they worked, while 70% did some or all of their work at their workplace (source: U.S. Bureau of Labor Statistics).
The comparable 2019 figure was 24%. The two measures capture different things, one counting workdays and one counting people, but both point to the same conclusion: a permanent reset at a much higher level, not a return to 2019.
How Many People Work From Home Right Now
The monthly headline number has barely moved. In March 2026, 22.6% of workers teleworked or worked at home for pay, and the rate has ranged only between 21.5% and 23.0% over the previous twelve months (source: U.S. Bureau of Labor Statistics).
On an annual basis, 35.4 million people teleworked or worked at home for pay in 2025, representing 22.4% of everyone at work. Of those, 11.9% of workers teleworked some of their hours and 10.5% teleworked all of their hours (source: U.S. Bureau of Labor Statistics).
In other words, fully remote and partially remote populations in the US are now almost exactly the same size.
Work From Home Statistics by Industry
Industry is the single strongest predictor of whether a person works from home. Telework rates in June 2026 broke down as follows (source: U.S. Bureau of Labor Statistics):
| Industry | Telework rate |
|---|---|
| Finance and insurance | 59.0% |
| Professional and technical services | 55.8% |
| Financial activities (total) | 52.5% |
| Information | 47.2% |
| Professional and business services | 41.8% |
| Public administration | 21.4% |
| Manufacturing | 19.6% |
| Education and health services | 18.0% |
| Wholesale and retail trade | 12.1% |
| Construction | 10.2% |
| Transportation and utilities | 10.0% |
| Leisure and hospitality | 7.7% |
| Accommodation and food services | 3.9% |
The spread between finance and insurance at 59.0% and accommodation and food services at 3.9% is roughly fifteen-fold. Any national average conceals that gap, which is why benchmarking against a sector figure is more useful than benchmarking against the headline rate.
Who Works From Home: Demographic Breakdown
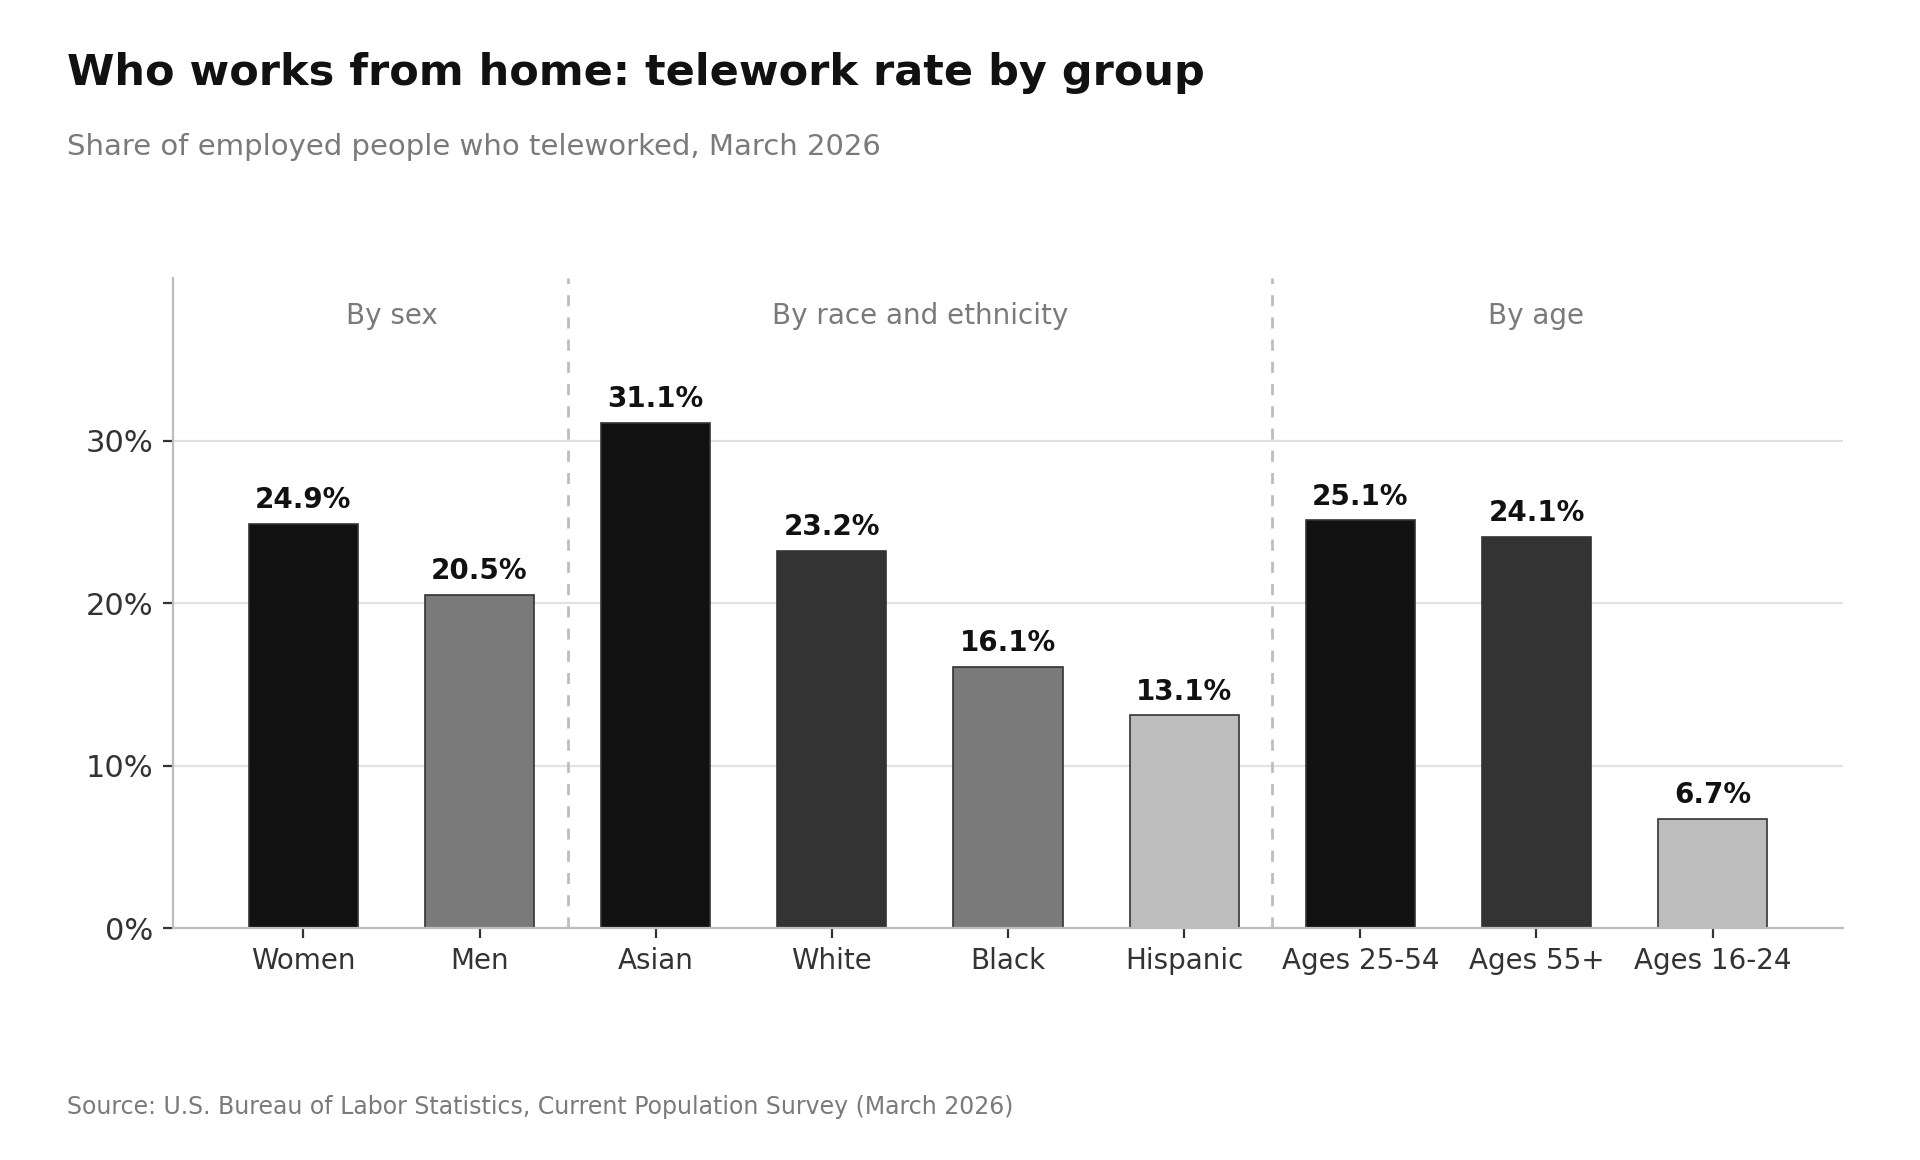
Telework rates diverge sharply across demographic groups. In March 2026, 24.9% of employed women teleworked compared with 20.5% of employed men, a gap that has persisted every single month since the data series began (source: U.S. Bureau of Labor Statistics).
By race and ethnicity in the same month, telework was most common among Asian workers at 31.1%, followed by White workers at 23.2%, Black workers at 16.1%, and Hispanic workers at 13.1%.
Age creates the widest split of all. Just 6.7% of workers aged 16 to 24 teleworked, compared with 25.1% of workers aged 25 to 54 and 24.1% of workers aged 55 and over (source: U.S. Bureau of Labor Statistics).
The common assumption that younger workers are the most remote is contradicted by the data, largely because entry-level and service roles cluster in on-site industries.
Hybrid vs Fully Remote: How the Split Actually Looks
Among US employees whose jobs can be done remotely, hybrid is the settled default. As of May 2026, 52% worked hybrid, 26% worked exclusively remotely, and 22% worked fully on-site (source: Gallup).
That distribution has been effectively frozen since early 2025, moving by no more than two percentage points in any category.
Preference data runs ahead of practice:
- Six in ten remote-capable employees want a hybrid arrangement
- About a third want to be fully remote
- Fewer than one in ten want to be on-site full time (source: Gallup).
- Roughly five in ten full-time US employees hold a remote-capable job at all, which is the ceiling on how far these numbers can ever go.
Retention risk sits squarely in the fully remote group.
Six in ten remote-capable employees who currently work exclusively remotely say they are extremely likely to look for a new job if remote flexibility is taken away (source: Gallup).
Work From Home Salaries and Pay Data
Remote roles concentrate at the higher end of the salary distribution because the jobs that can be done from home are disproportionately professional and technical.
Among the highest-paying remote roles in 2026:
- Psychiatrists lead with an average listed remote salary of $300,000, with 98% of listings fully remote.
- Product designers average $145,334 with top listings reaching $195,000,
- Enterprise account executives average $140,000 with top listings at $250,000,
- Product marketing managers average $129,600 with 52% of listings fully remote (source: Forbes).
Flexibility itself also carries a measurable price. Research from the Survey of Working Arrangements and Attitudes finds employees value the ability to work from home two to three days per week at roughly 8% of pay, meaning many would trade that share of salary to keep the arrangement (source: WFH Research).
For employers, that is an 8% compensation lever that costs nothing to pull.
The Hiring Gap: Remote Work vs Remote Job Postings
This is where 2026 gets contradictory. Actual work from home levels are flat, but advertised flexibility has collapsed.
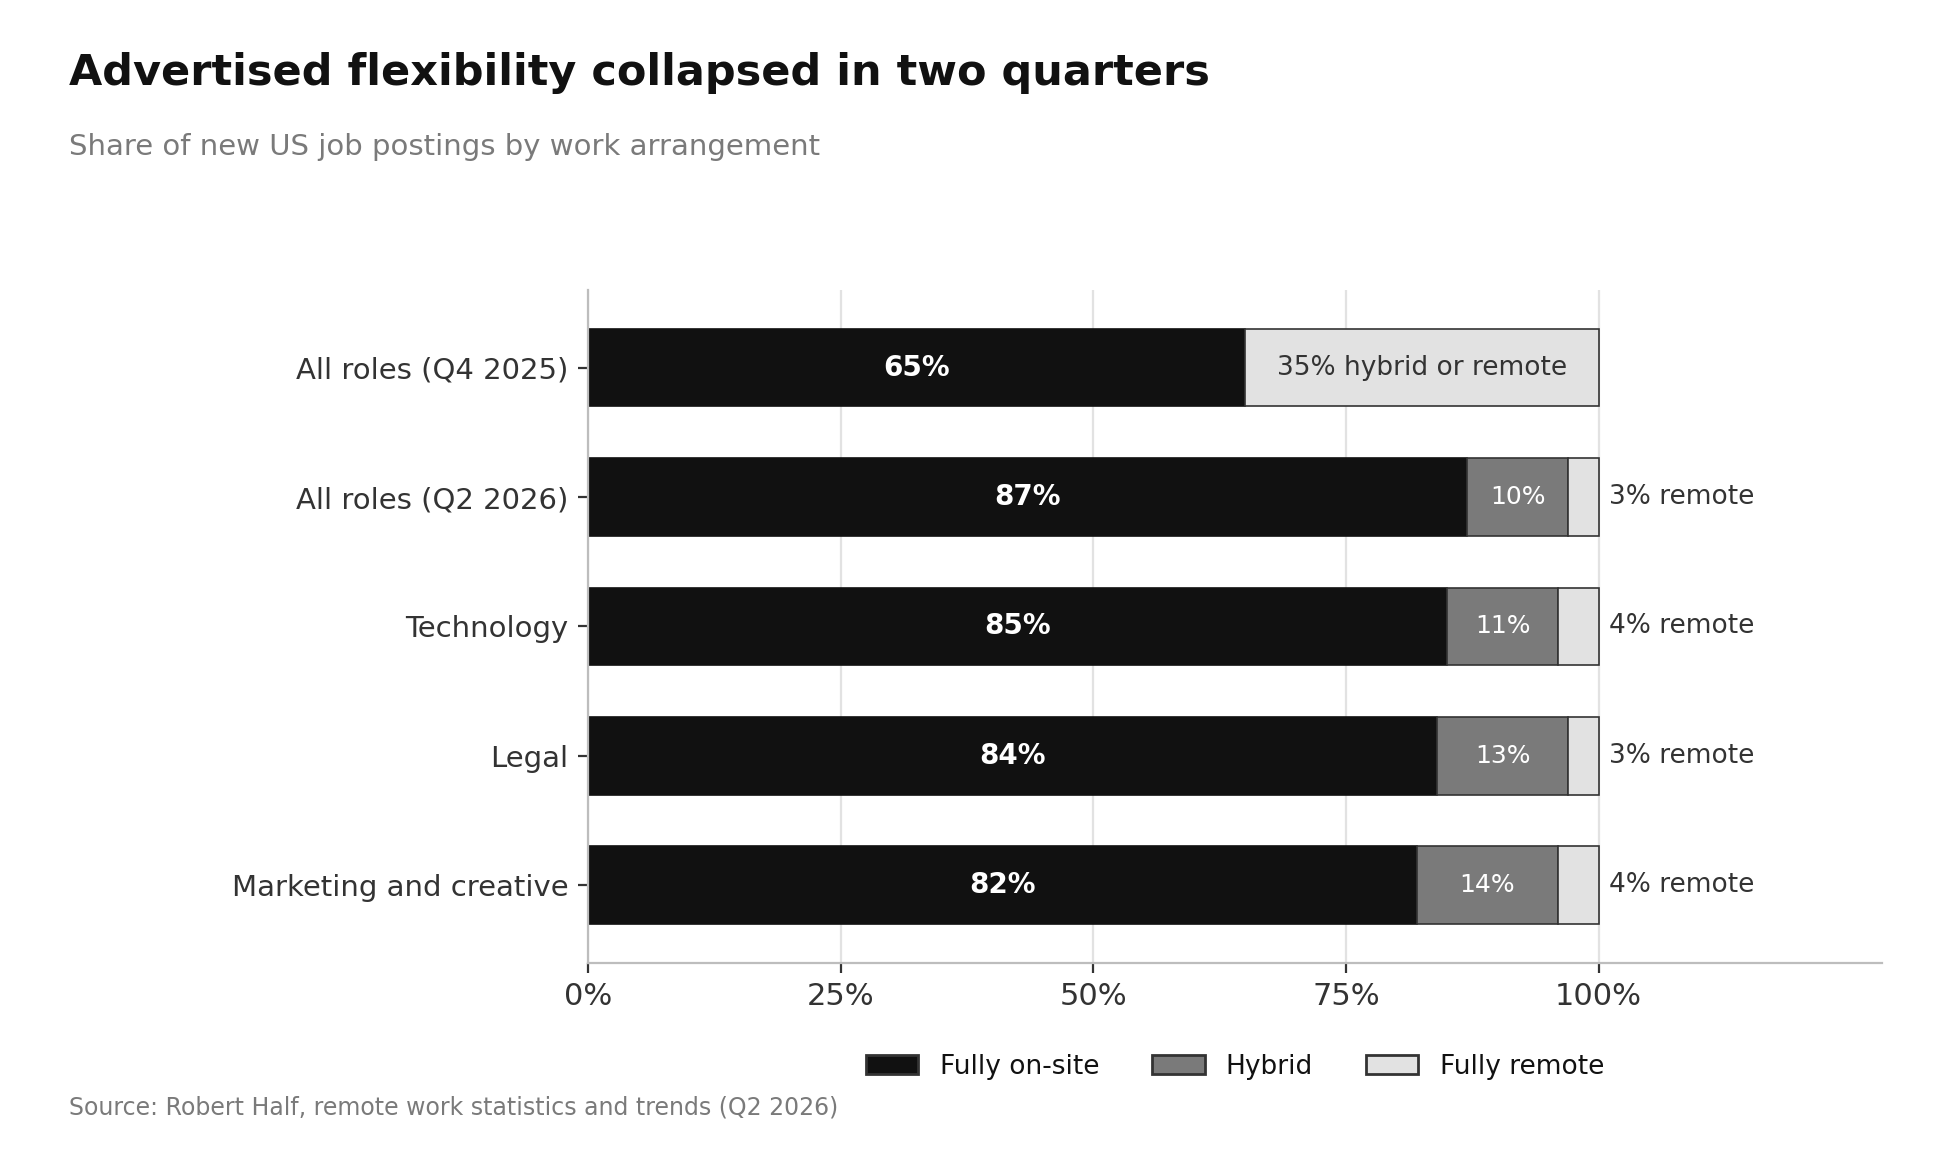
Of US job postings analyzed in Q2 2026, 87% were fully on-site, 10% were hybrid, and just 3% were fully remote.
The fully in-office share jumped from 65% in Q4 2025 to 87% in Q2 2026 in only two quarters, and 36% of employers report increasing required on-site days over the past year (source: Robert Half).
Field-level Q2 2026 postings data shows how little variation is left. Marketing and creative roles ran 82% on-site, 14% hybrid, and 4% remote.
Legal roles ran 84% on-site, 13% hybrid, and 3% remote. Technology roles ran 85% on-site, 11% hybrid, and 4% remote (source: Robert Half).
Worker demand has not followed. 46% of professionals are already looking or planning to look for a new role in the second half of 2026 (source: Robert Half).
The result is a supply and demand mismatch: existing employees keep their flexibility while new postings quietly remove it.
Productivity, Retention, and Performance Statistics
The strongest evidence on hybrid work comes from a six-month randomized controlled trial of 1,612 employees, published in Nature.
Hybrid working improved job satisfaction and reduced quit rates by one-third, with no measurable damage to performance reviews, promotion rates, or output.
Reductions in attrition were largest for non-managers, female employees, and those with long commutes, where quit rates fell by 52% (source: Nature).
Time is the mechanism. On days worked from home, the average US employee saves about 70 minutes per day that would otherwise go to commuting and preparing for work (source: NBER).
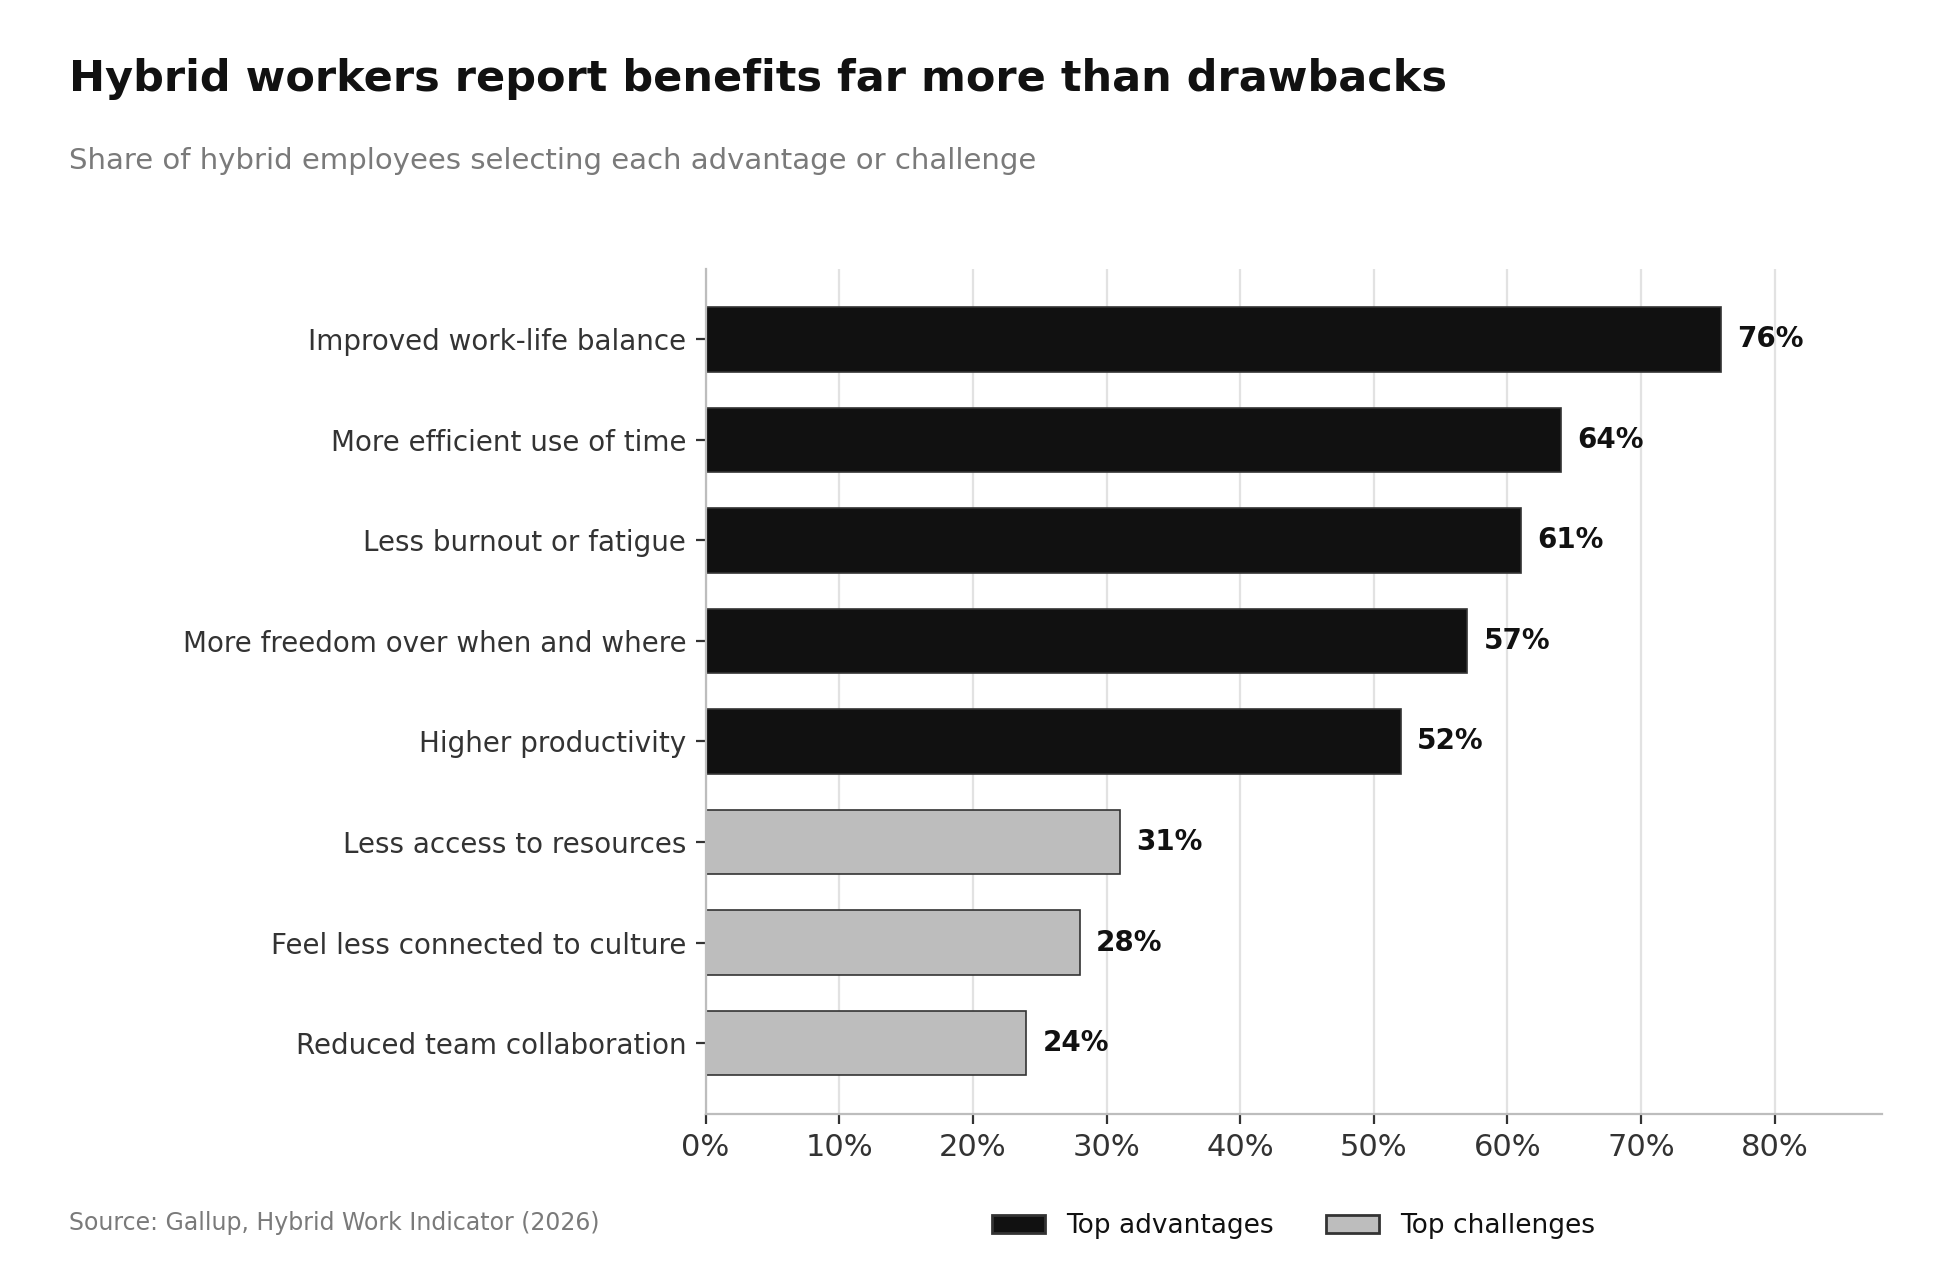
Employees report the benefits far more often than the drawbacks.
Hybrid workers cite improved work-life balance at 76%, more efficient use of time at 64%, less burnout or fatigue at 61%, more freedom over when and where they work at 57%, and higher productivity at 52%.
The leading challenges are less access to work resources at 31%, feeling less connected to organizational culture at 28%, and decreased team collaboration at 24% (source: Gallup).
Return-to-Office Mandates: What the Data Shows
Return-to-office announcements generate headlines disproportionate to their measured effect.
Stanford research calculated that planned shifts back to on-site work would reduce the overall share of paid work-from-home days by less than half a percentage point, from 21.2% to 20.8%, and found that US firms do not see any material trend back to the office (source: Stanford).
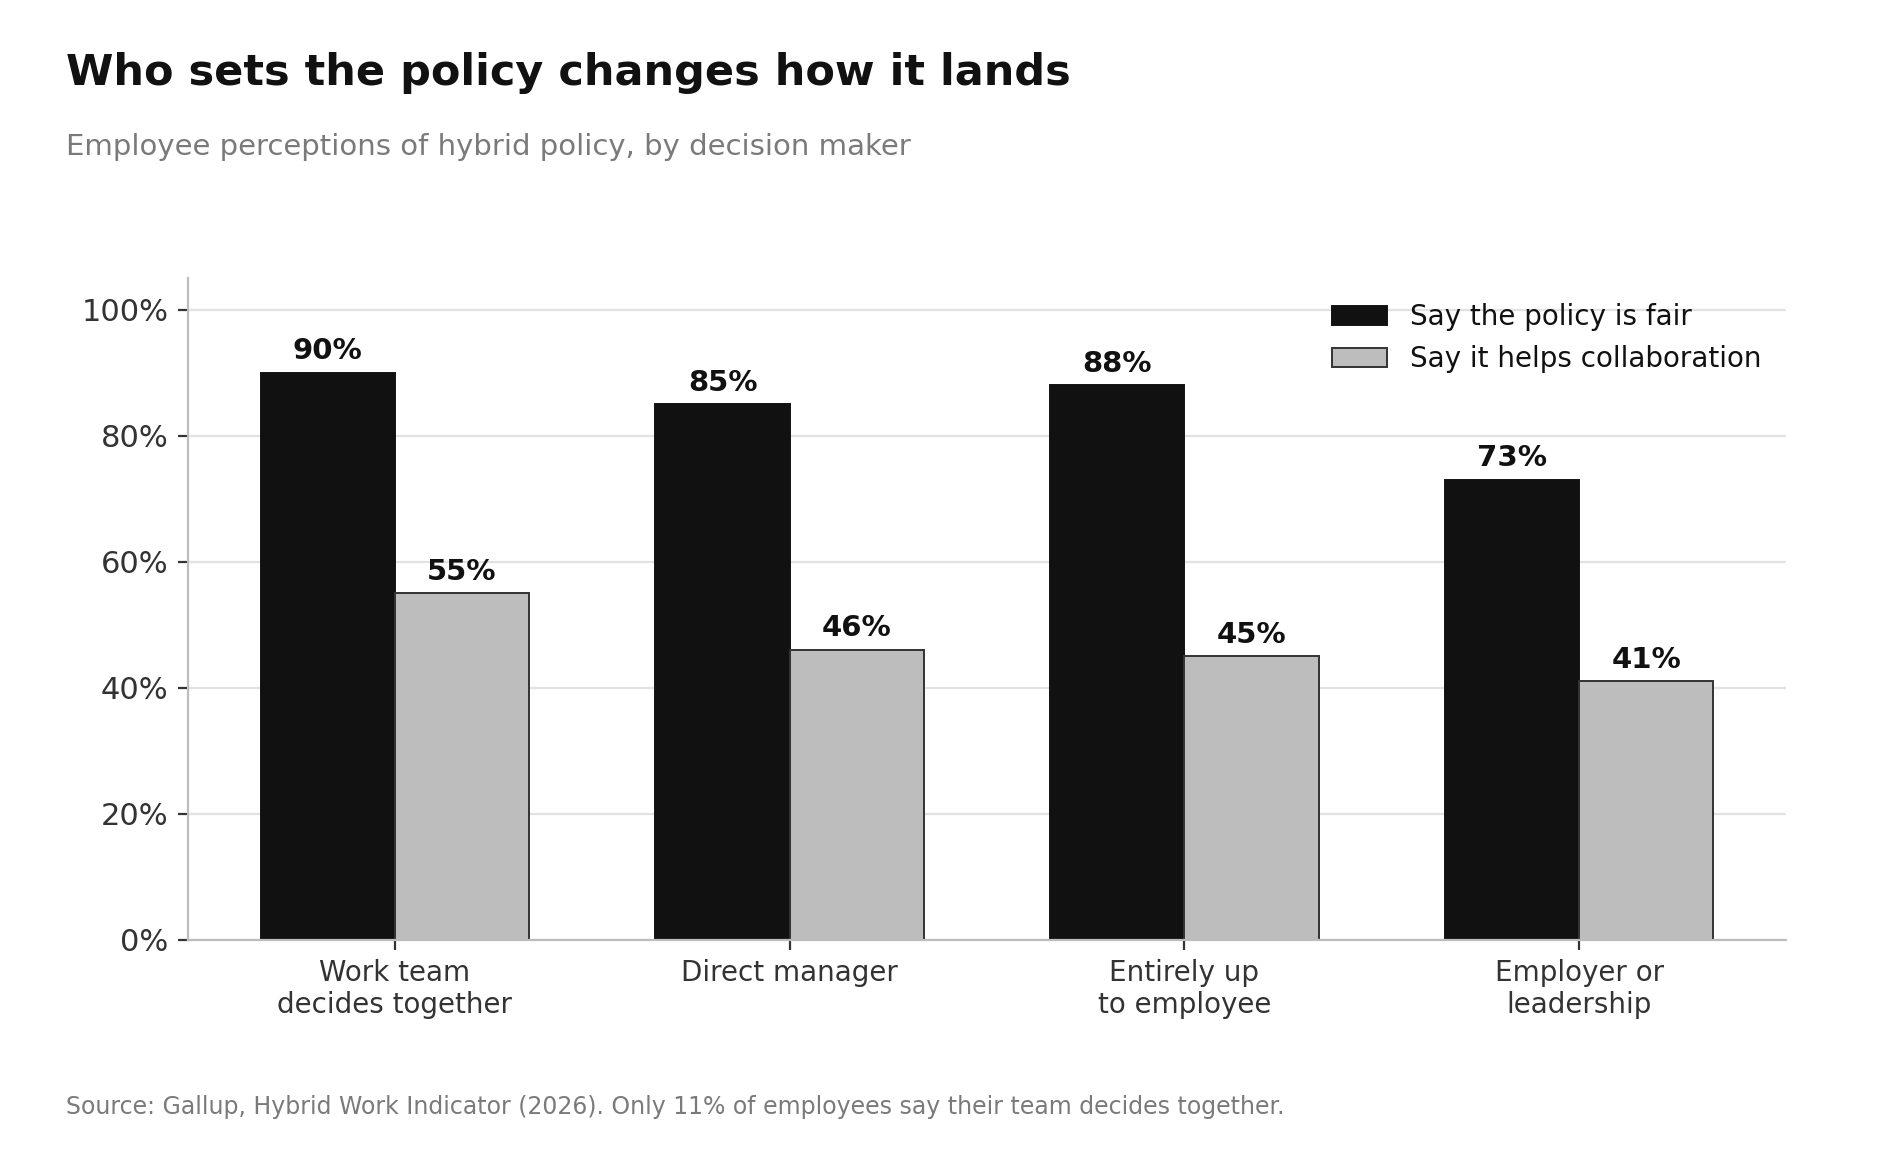
How a policy is set matters more than what the policy says.
Only 11% of employees say their work team decided its hybrid policy together, yet those teams report the best outcomes: 90% call the policy fair and 55% say it has a positive impact on collaboration.
Where the employer or leadership sets the policy unilaterally, only 73% call it fair and just 41% report a positive collaboration impact (source: Gallup).
Global Work From Home Statistics
The US is an outlier on the high end. Across the EU, 9% of employed people usually worked from home in 2025, up from about 5.5% in 2019 but down from the 13.5% pandemic peak in 2021 (source: Eurostat).
Within Europe, the spread is close to twenty percentage points.
Finland leads at 21.1% and Ireland follows near 19.8%, while Romania sits at 1.3%. Germany has climbed from 4.2% in 2006 to 13.3% in 2025 (source: Eurostat).
Globally, the Global Survey of Working Arrangements finds college-educated full-time workers average about 1.27 work-from-home days per week, down from 1.6 days in 2022 and stable since 2024.
North America, the UK, and Australia sit highest at 1.5 to 2 days per week, and Asia sits lowest (source: WFH Research).
Culture, not technology or industry mix, explains most of the variation between countries.
What the Data Signals Going Into 2027
Three signals stand out:
- First, the underlying work-from-home rate has not moved outside a two-point band in three years, which makes further large declines unlikely absent a major labor market shock.
- Second, the flexibility that exists is increasingly concentrated among incumbent employees rather than new hires, since only 3% of Q2 2026 postings are fully remote.
- Third, the evidence base now favors hybrid on retention economics, with a one-third reduction in quit rates and no performance penalty.
For employers, the practical question has shifted from whether to allow work from home to how many days, who decides, and what the turnover cost of getting it wrong will be.
Conclusion
Work from home in 2026 is stable rather than shrinking, with roughly 22.6% of US workers teleworking, about 27% of paid workdays performed at home, and 52% of remote-capable employees working hybrid.
Industry, age, and geography drive far more variation than any national average suggests, and the sharpest change this year is not in how people work but in how few new roles are advertised as remote.
The organizations that will benefit are the ones treating flexibility as a measurable retention asset rather than a cultural argument.
Read Next
FAQs
1. What percentage of people work from home in 2026?
The percentage of people who work from home in 2026 is approximately 22.6% of US workers, who teleworked or worked at home for pay in March 2026, a rate that has held between 21.5% and 23.0% over the past year (source: U.S. Bureau of Labor Statistics).
2. Which industry has the highest work from home rate?
The industry with the highest work from home rate is finance and insurance, at 59.0% in June 2026, followed by professional and technical services at 55.8% and information at 47.2% (source: U.S. Bureau of Labor Statistics).
3. Is hybrid work more common than fully remote work?
Hybrid work is more common than fully remote work, with 52% of remote-capable US employees working hybrid compared with 26% working exclusively remotely and 22% working fully on-site as of May 2026 (source: Gallup).
4. Does working from home reduce productivity?
Working from home does not reduce productivity in hybrid arrangements, according to a randomized controlled trial of 1,612 employees that found no impact on performance reviews, promotions, or output, alongside a 33% reduction in quit rates (source: Nature).
5. How many job postings are fully remote in 2026?
The share of job postings that are fully remote in 2026 is 3%, with 10% hybrid and 87% fully on-site among US postings analyzed in Q2 2026, up from 65% fully on-site in Q4 2025 (source: Robert Half).
Disclaimer: This content is provided for informational purposes only and does not constitute legal, financial, or compliance advice. Protocol versions, governance arrangements, and partner counts cited here reflect publicly announced milestones as of August 2026 and are moving quickly. Adoption figures come from vendor and foundation announcements with differing methodologies and should be treated as directional signals rather than guaranteed outcomes.