
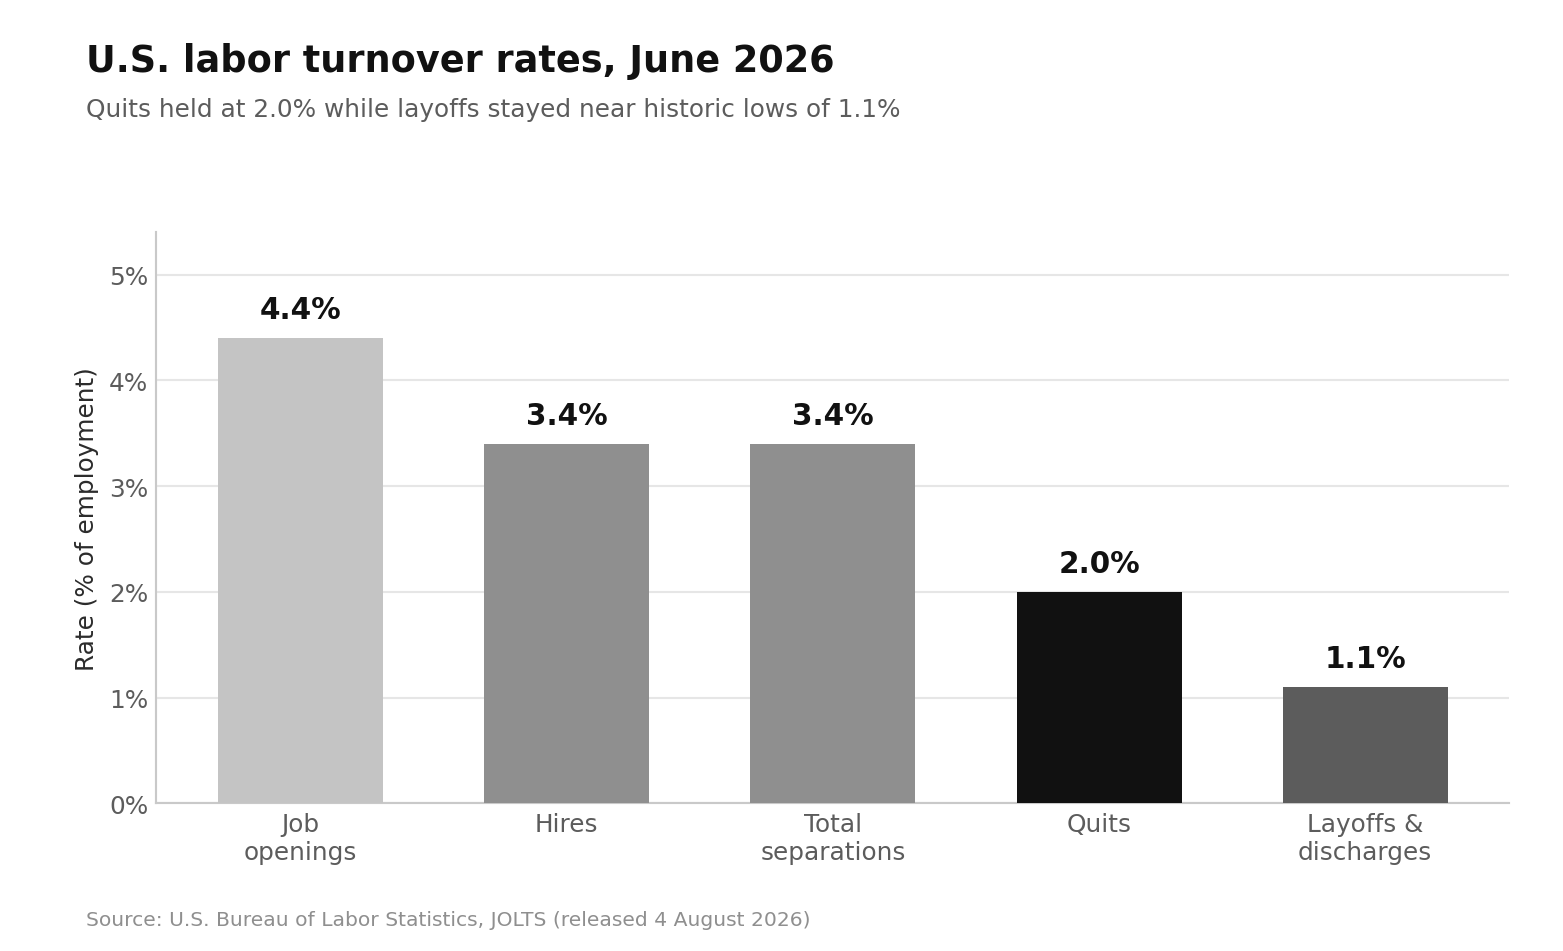
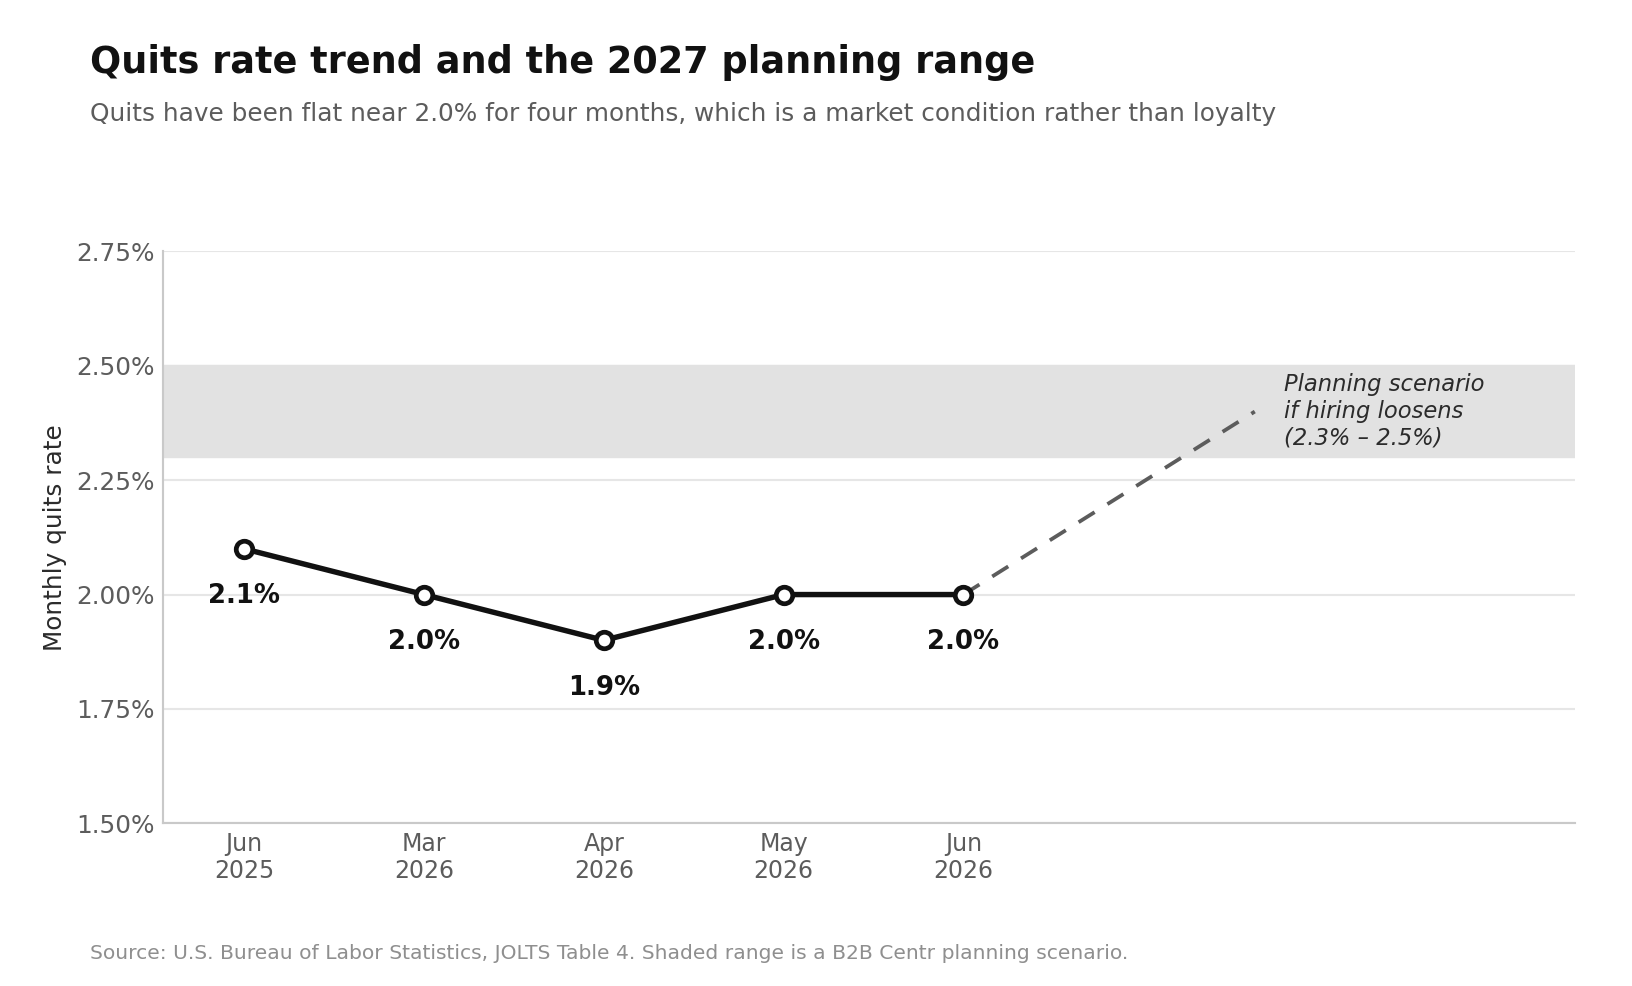
In June 2026, 3.2 million Americans voluntarily quit their jobs, holding the national quits rate at 2.0% for the fourth straight month (source: U.S. Bureau of Labor Statistics).
B2B Centr publishes the operating benchmarks that B2B leaders use to make workforce and go-to-market decisions with real numbers instead of assumptions.
Retention has shifted from a talent-shortage problem into a cost-control problem: fewer people are leaving, but the ones who do leave now cost more to replace than at any point in the past decade.
That combination is reshaping how finance and HR teams budget for headcount.
This report breaks down the current employee retention statistics across quit rates, industry benchmarks, replacement costs, tenure, pay growth, and engagement, so you can benchmark your own numbers against the market.
Key Takeaways
- The U.S. quits rate sits at 2.0%, roughly 33% below the 2022 peak.
- Replacing one employee costs between 50% and 200% of annual salary.
- Median U.S. employee tenure fell to 3.9 years, the lowest since 2002.
- Job changers earn 7.0% pay growth versus 4.4% for stayers.
- Global engagement dropped to 20%, costing an estimated $10 trillion in productivity.
Section 1: The 2026 Labor Market Backdrop
Retention numbers only make sense against the hiring market that produces them. The current environment is widely described as "low hire, low fire," and the data supports it.
As of June 2026, there were 7.4 million job openings in the United States, a rate of 4.4%, while hires held at 5.3 million (3.4%) and total separations at 5.4 million (3.4%) (source: U.S. Bureau of Labor Statistics). Layoffs and discharges stayed flat at 1.8 million, a rate of 1.1%, which is historically low.
The practical effect is that voluntary attrition has cooled without employers doing much to earn it. Workers are staying because outside options are thinner, not because engagement improved.
That distinction matters, because suppressed quit rates create a backlog of disengaged employees who will move as soon as hiring loosens.
For context on how this connects to recruiting volume and budget, see our breakdown of hiring statistics for 2026.
Section 2: Why Retention Became a Finance Metric
Turnover used to be tracked as an HR health indicator. In 2026, it is a line item.
The Achievers Workforce Institute found that only 25% of employees envision a long career with their current company, and 34% say they plan to look for a new job in 2026.
If that intent converts, the estimated cost of turnover to U.S. employers falls between $1.3 trillion and $5.1 trillion (source: Achievers Workforce Institute).
Gallup separately estimates that voluntary turnover costs U.S. businesses roughly $1 trillion per year once recruiting, onboarding, training, and lost productivity are counted (source: Turnozo).
The gap between "34% plan to leave" and "2.0% actually quit each month" is the single most important number in this report. It represents deferred attrition, and it is sitting on most payrolls right now.
Section 3: Quit Rates by Industry
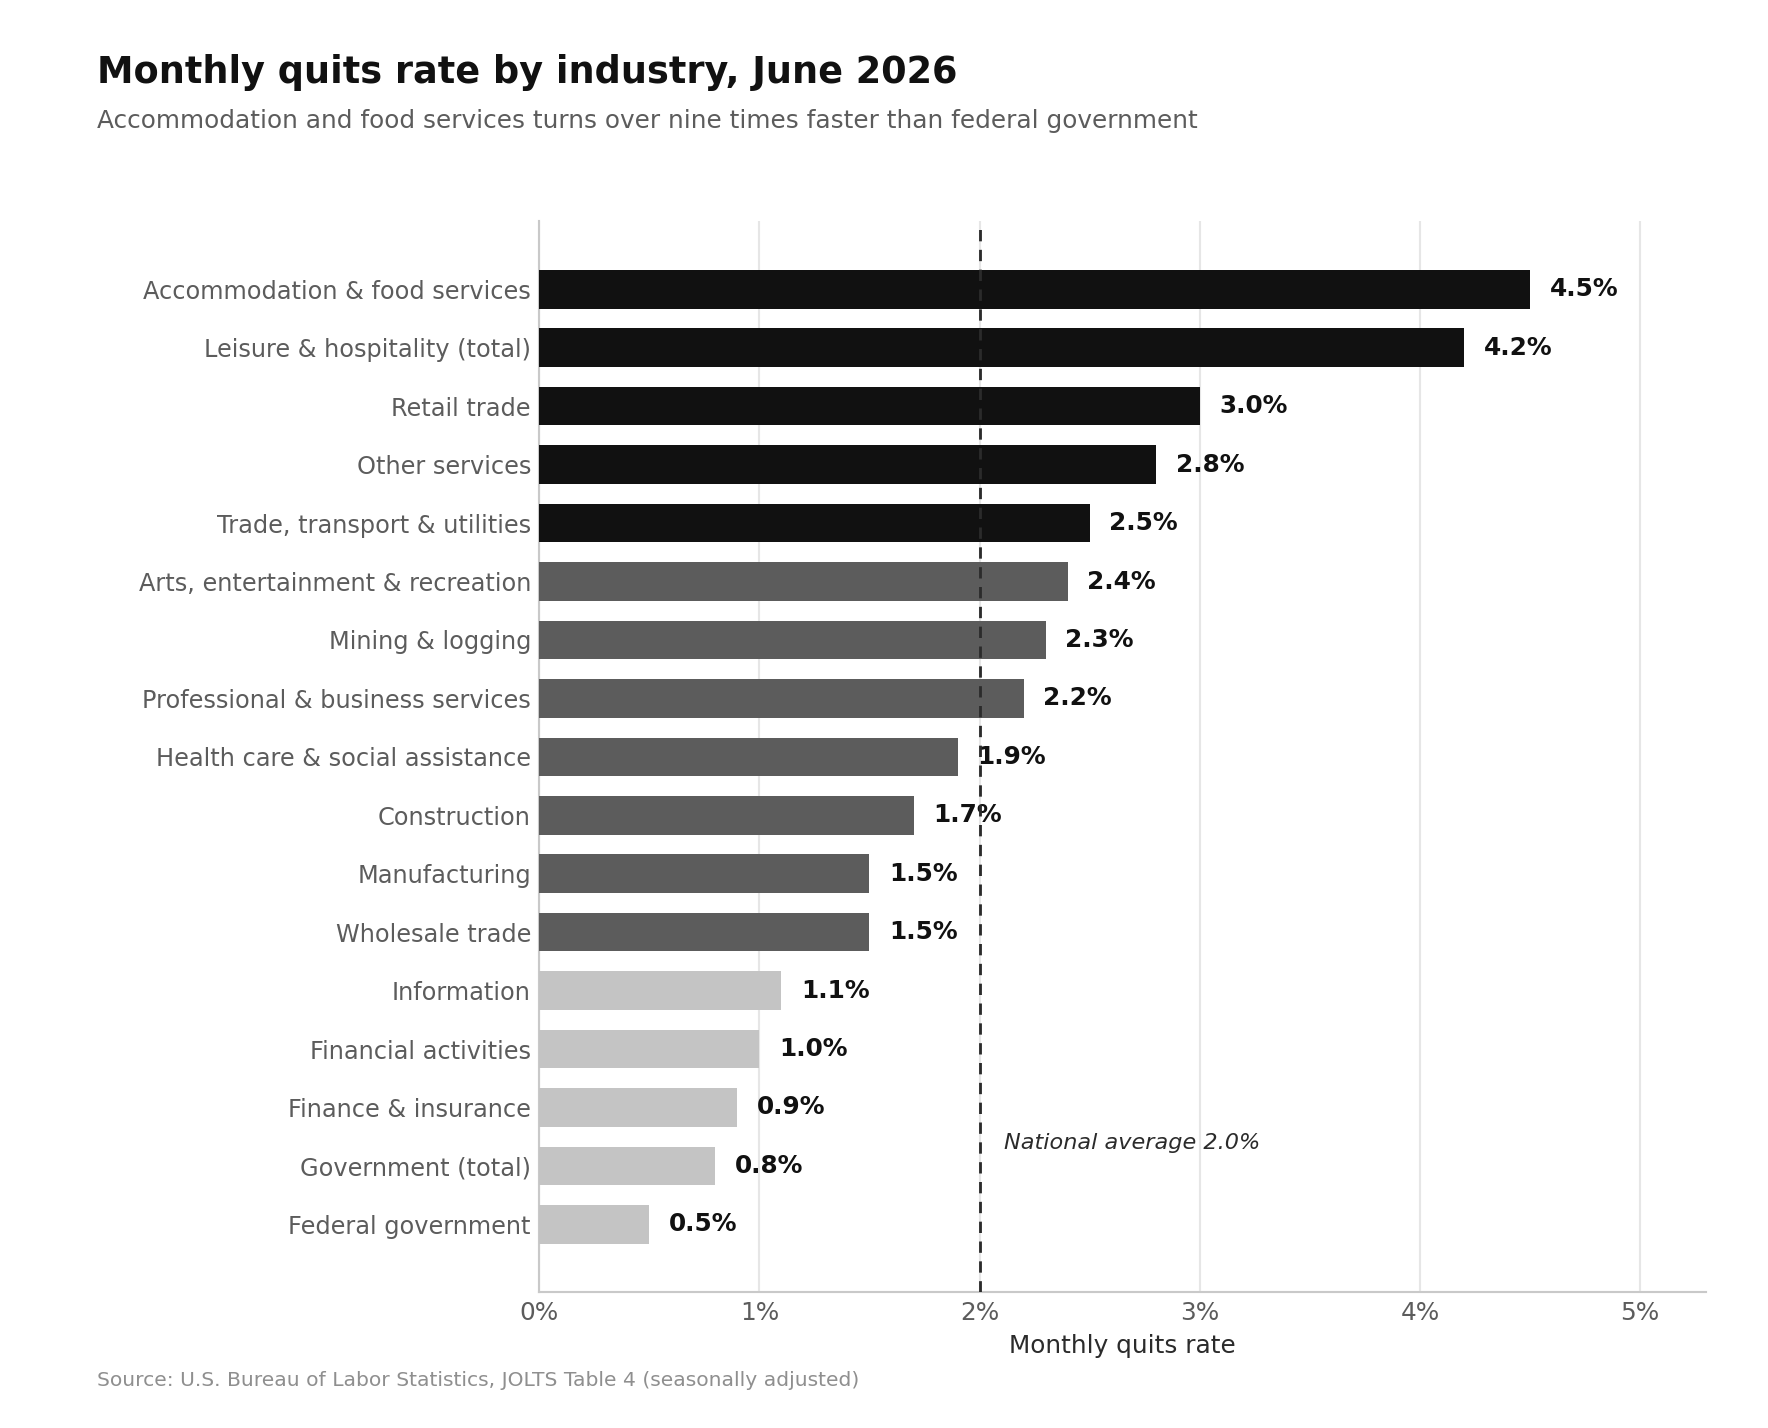
Quit rates vary more by industry than by almost any other variable. Below are the seasonally adjusted quits rates for June 2026 (source: U.S. Bureau of Labor Statistics).
Three patterns stand out:
- First, accommodation and food services still runs a quits rate more than twice the national average, though it has fallen sharply from 5.5% in June 2025.
- Second, information and finance have effectively frozen, with finance and insurance at 0.9%, down from 1.3% a year earlier.
- Third, government retention is structurally different, with federal quits at just 0.5%.
Section 4: Quit Rates by Region
Regional variation is smaller but still meaningful for multi-site employers (source: U.S. Bureau of Labor Statistics):
- South: 2.2% (1,347,000 quits)
- West: 2.1% (775,000 quits)
- Midwest: 2.0% (677,000 quits)
- Northeast: 1.5% (434,000 quits)
The Northeast has the stickiest workforce in the country, running 0.7 points below the South. The West saw the sharpest month-over-month move, rising 0.3 points in June 2026.
Section 5: What Turnover Actually Costs
This is where retention math gets expensive.
The most cited benchmark, from Gallup, puts the cost of replacing an employee at 50% to 200% of that employee's annual salary, depending on role complexity and seniority (source: Qooper).
Broken down by role level:
| Role Level | Typical Replacement Cost |
|---|---|
| Entry-level | ~$15,000 per departure |
| Mid-level professional | $50,000 to $90,000 (100% to 150% of salary) |
| Manager or specialist | $50,000 to $200,000+ |
| Executive | Up to 213% of salary |
Source: VA Masters
Healthcare carries the heaviest per-employee burden. Replacing a registered nurse costs roughly $56,300, and physician replacement can exceed $500,000 once lost revenue during the vacancy is included (source: Turnozo).
Scaled up, a 500-person company with an average salary of $60,000 and 15% annual turnover carries roughly $4.2 million in annual replacement costs before soft productivity losses (source: Stealth Agents).
For salary baselines to run your own calculation, our average salary by age breakdown and the 2026 startup salaries report are useful starting points.
Section 6: Cost Per Hire and Time to Fill
Replacement cost is the full picture. Cost per hire is the visible slice, and it has climbed steadily.
- SHRM's 2025 Benchmarking Report puts average cost per hire at $5,475 for non-executive roles and $35,879 for executives, the latter up 21% from 2022 (source: Pin).
- SHRM's 2026 Recruiting Executives Benchmarking report, based on 4,657 members surveyed between November 2025 and January 2026, reports a median of $1,300 non-executive and $15,000 executive, both up from $1,200 and $10,600 the prior year (source: Truffle).
- Median time to fill dropped from 67.7 days in 2025 to 63.5 days in 2026 among tracked companies (source: Pin).
- Roughly 22% of new hires leave within 90 days, which resets the cost-per-hire clock at full price (source: Pin).
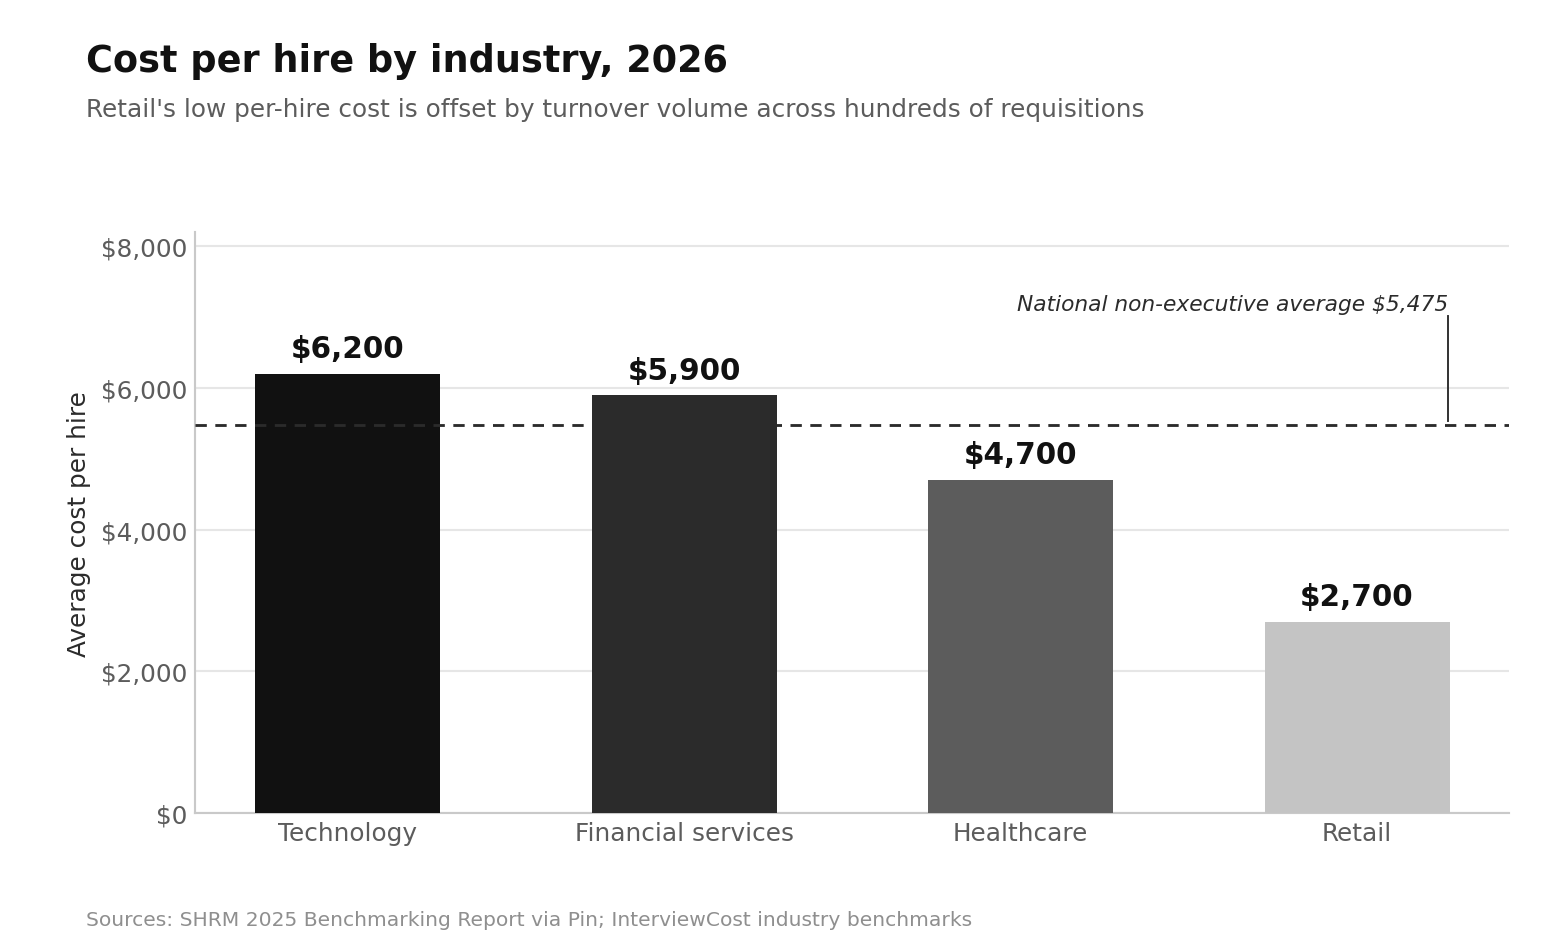
By industry, 2026 cost per hire averages roughly $6,200 in tech, $5,900 in finance, $4,700 in healthcare, and $2,700 in retail (source: InterviewCost). Retail's low per-hire figure is misleading, because high annual turnover multiplies it across hundreds of req cycles.
Section 7: Employee Tenure Statistics
Tenure is the cleanest long-run retention indicator, and it is trending down.
Median tenure with a current employer fell to 3.9 years in January 2024, down from 4.1 years in 2022 and the lowest level since January 2002 (source: U.S. Bureau of Labor Statistics).
Additional tenure findings from the same release:
- Median tenure for men was 4.2 years; for women, 3.6 years.
- 28% of men had 10 or more years with their employer, versus 24% of women.
- Workers aged 55 to 64 had a median tenure of 9.6 years, more than triple the 2.7 years for workers aged 25 to 34.
- 22% of all wage and salary workers had a year or less of tenure.
- Food preparation and serving occupations had the lowest median tenure at 2.0 years.
The age gap is the operational takeaway. If your workforce skews under 35, a 2 to 3 year average tenure is the market baseline, not a failure.
Section 8: The Pay Premium That Drives Voluntary Exits
Compensation is the most quantifiable retention lever, and the switching premium is still real.
ADP's July 2026 Pay Insights reported median year-over-year pay growth of 4.4% for job stayers and 7.0% for job changers, a 2.6 point gap and the largest job-changer increase since August 2025 (source: Marketplace).
Median annual pay for job stayers sat at roughly $60,300 (source: ADP).
The Atlanta Fed's wage growth tracker, which uses a different sample and measures hourly wages, shows a much narrower gap: 3.4% for stayers versus 4.1% for switchers in June 2026 (source: Axios).
The honest read is that the premium exists but is smaller than headline numbers suggest, and it varies sharply by sector.
Construction and financial services carry the widest switching premiums; leisure and hospitality workers are often better off staying (source: ADP Research).
Practical implication: a 3% merit cycle in a market where switchers gain 7% creates a compounding retention gap for your highest performers.
Payroll planning context is available in our 2026 payroll spending report.
Section 9: Engagement and the Manager Effect
Engagement is the leading indicator that shows up before quit rates move.
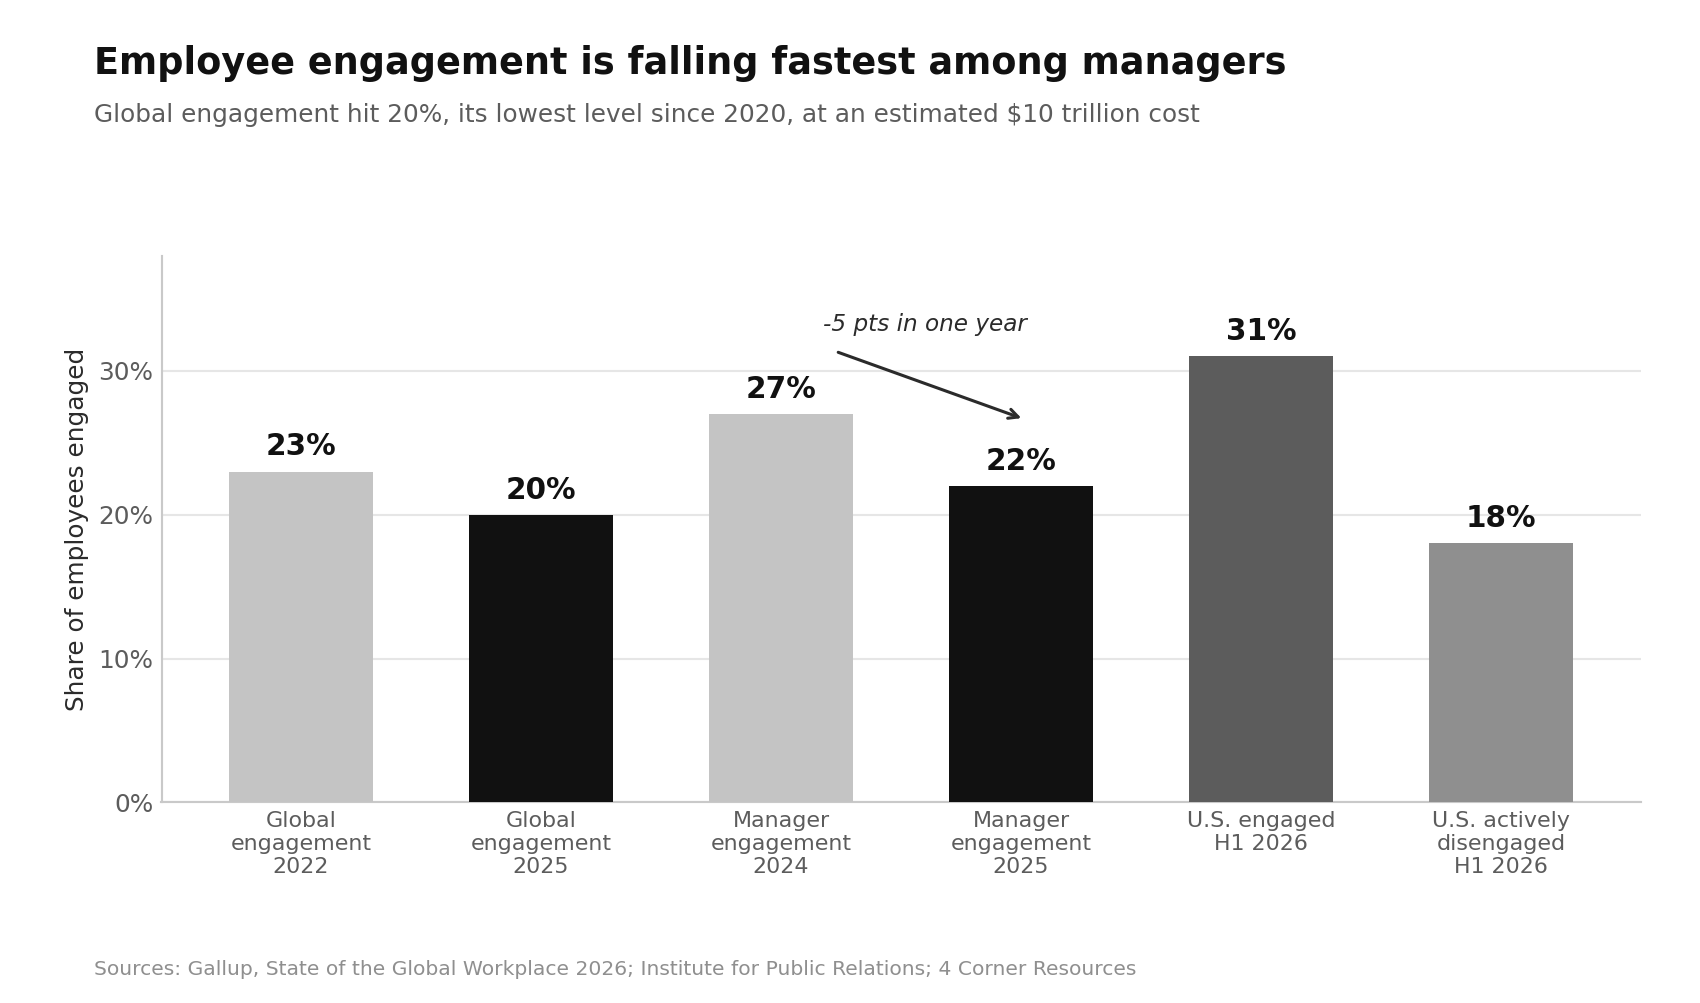
Global employee engagement fell to 20% in 2025, down from a 2022 peak of 23% and the lowest level since 2020, marking the first back-to-back annual decline Gallup has recorded.
Gallup estimates low engagement costs the global economy $10 trillion annually, or roughly 9% of global GDP (source: Gallup).
The decline is concentrated in one layer. Manager engagement dropped from 27% in 2024 to 22% in 2025, while individual contributor engagement stayed roughly flat (source: Institute for Public Relations).
Best-practice organizations recorded manager engagement of 79%, nearly four times the global average (source: UNLEASH).
In the U.S., 31% of employees were engaged during the first half of 2026, unchanged from 2025, with 18% actively disengaged.
Engagement peaked at 36% in 2020, which works out to roughly 8 million fewer engaged U.S. workers (source: 4 Corner Resources).
Gallup's Q12 meta-analysis found that top-quartile engaged teams show a 51% difference in turnover compared to bottom-quartile teams (source: Evolveup).
If you are evaluating tooling in this area, employee engagement software and HR software for smaller teams are the usual starting points.
Section 10: Flexibility, RTO, and Retention Risk
Flexibility is the retention variable that changed most in 2026, and not in the direction most forecasts predicted.
Only 7% of U.S. workers now say they would quit outright over a mandatory return-to-office policy, down from 51% in January 2025.
Additionally, 74% expect the same or less bargaining power to demand flexibility in 2026, and 46% expect employers to become stricter about on-site attendance (source: HR Dive).
That does not mean flexibility stopped mattering. A randomized controlled trial published in Nature found that two days of work from home per week reduced quit rates by one-third with no measurable damage to performance ratings over the following two years (source: The Hill).
Gains were largest among non-managers, women, and workers with long commutes.
Separately, Owl Labs found that 40% of hybrid employees would start searching for a new job if flexibility were removed, and 22% would demand a raise to offset the loss (source: Speakwise).
Read together, these numbers describe compliance rather than acceptance. Employees are absorbing mandates because leverage shifted, and the intent to leave is being stored, not eliminated.
Our work from home statistics and remote work tech costs breakdowns cover the operational side of this.
Section 11: Career Development as a Retention Lever
Development consistently outperforms perks in retention research.
- 88% of organizations say employee retention is a concern, and providing learning opportunities is the top retention strategy they report using (source: LearnExperts).
- At the two-year mark, an employee who has made an internal move is nearly 20% more likely to stay than one who has not (source: LinkedIn Learning).
- Only 24% of organizations have structured internal mobility programs (source: Thirst).
- Only 30% of employees strongly agree that someone at work encourages their development, down from 36% in 2020 (source: WorkTime).
The gap between 88% of employers calling retention a concern and 24% having a mobility program is the clearest unexploited opportunity in this dataset.
Section 12: How to Benchmark Your Own Retention Rate
Use these formulas and compare against the figures above.
Turnover rate = (separations during period ÷ average headcount) × 100
Retention rate = ((headcount at end − new hires) ÷ headcount at start) × 100
Track four categories separately, because each requires a different response: voluntary, involuntary, regrettable, and early (under 90 days). A blended number hides the problem.
Benchmark against your industry quits rate from Section 3, not the 2.0% national average. A 3.0% monthly quits rate is a crisis in finance and roughly average in retail.
Section 13: What This Means for 2027 Planning
Three things follow from the data:
- First, budget for deferred attrition: With 34% of employees planning a move and monthly quits at 2.0%, the current calm is a function of market conditions rather than loyalty. Model a scenario where hiring loosens and quits return toward the 2.3% to 2.5% range.
- Second, treat manager engagement as the intervention point: Manager engagement fell 5 points in a single year while individual contributor engagement held flat, which means the leverage sits in one layer of your org chart.
- Third, close the compensation gap for critical roles specifically rather than across the board: A 2.6 point pay premium for switchers does not require a 7% raise for everyone; it requires targeted correction where replacement cost is highest.
For smaller organizations weighing these tradeoffs, our small business statistics report and the 2026 HR tech spending report provide additional budget context.
Conclusion
B2B Centr tracks the workforce, hiring, and spending benchmarks that B2B operators need to plan headcount with real numbers rather than vendor claims.
The 2026 employee retention picture is defined by a contradiction: quit rates are near decade lows at 2.0%, yet a third of employees say they intend to leave, engagement has fallen to 20% globally, and median tenure has dropped to 3.9 years.
Replacement costs of 50% to 200% of salary mean that even modest turnover carries material P&L impact, and the widest gaps in the data (manager engagement, internal mobility, and targeted pay correction) are also the cheapest to close.
Retention in 2026 is less about preventing exits and more about deciding which ones you can afford.
Read Next
FAQs
1. What is the average employee retention rate in 2026?
The average employee retention rate in 2026 corresponds to a national quits rate of 2.0% per month, or roughly 3.2 million voluntary departures monthly, which translates to an annualized voluntary turnover rate of approximately 24% across all U.S. nonfarm employment (source: U.S. Bureau of Labor Statistics).
2. How much does it cost to replace an employee in 2026?
Replacing an employee in 2026 costs between 50% and 200% of that employee's annual salary, with entry-level departures averaging around $15,000 and mid-level replacements running $50,000 to $90,000 once recruiting, onboarding, and lost productivity are counted (source: Qooper).
3. Which industry has the highest employee turnover rate?
The industry with the highest employee turnover rate is accommodation and food services, at a 4.5% monthly quits rate in June 2026, followed by leisure and hospitality overall at 4.2% and retail trade at 3.0% (source: U.S. Bureau of Labor Statistics).
4. What is the average employee tenure in the United States?
The average employee tenure in the United States is a median of 3.9 years as of January 2024, the lowest recorded since January 2002, with men at 4.2 years and women at 3.6 years (source: U.S. Bureau of Labor Statistics).
5. Do employees earn more by switching jobs in 2026?
Employees do earn more by switching jobs in 2026, with job changers seeing 7.0% median year-over-year pay growth versus 4.4% for job stayers, though the Atlanta Fed's hourly wage measure shows a narrower gap of 4.1% versus 3.4% (source: Marketplace).
Disclaimer: This content is provided for informational purposes only and does not constitute legal, financial, or compliance advice. Protocol versions, governance arrangements, and partner counts cited here reflect publicly announced milestones as of August 2026 and are moving quickly. Adoption figures come from vendor and foundation announcements with differing methodologies and should be treated as directional signals rather than guaranteed outcomes.