
Sixty-seven percent of B2B buyers now say they would rather complete a purchase without any sales representative involved, according to a Gartner survey of 646 buyers released in March 2026 (source: Digital Commerce 360).
B2B Centr tracks the data behind that shift so operators, distributors and SaaS teams can make channel decisions from evidence rather than instinct.
B2B ecommerce has moved from a secondary order-capture channel to the primary transaction layer for manufacturing, wholesale and industrial distribution, and it is now growing at double-digit rates even in quarters when total B2B demand is flat.
This report breaks down the current numbers across market size, growth, buyer behavior, channel mix, conversion benchmarks, AI adoption, regional share and compensation, with every figure attributed to its source.
Key Takeaways
- Global B2B ecommerce reached roughly $32.1 trillion in 2025, growing about 14% year over year.
- US B2B ecommerce sales hit $2.93 trillion in 2025, up 13% despite flat total demand.
- 67% of B2B buyers prefer a purchase process with no sales representative involved.
- Gartner expects 90% of B2B buying to flow through AI agents by 2028.
- B2B session-to-purchase conversion sits in a defensible 1.8% to 3.0% range.
Global B2B Ecommerce Market Size in 2026
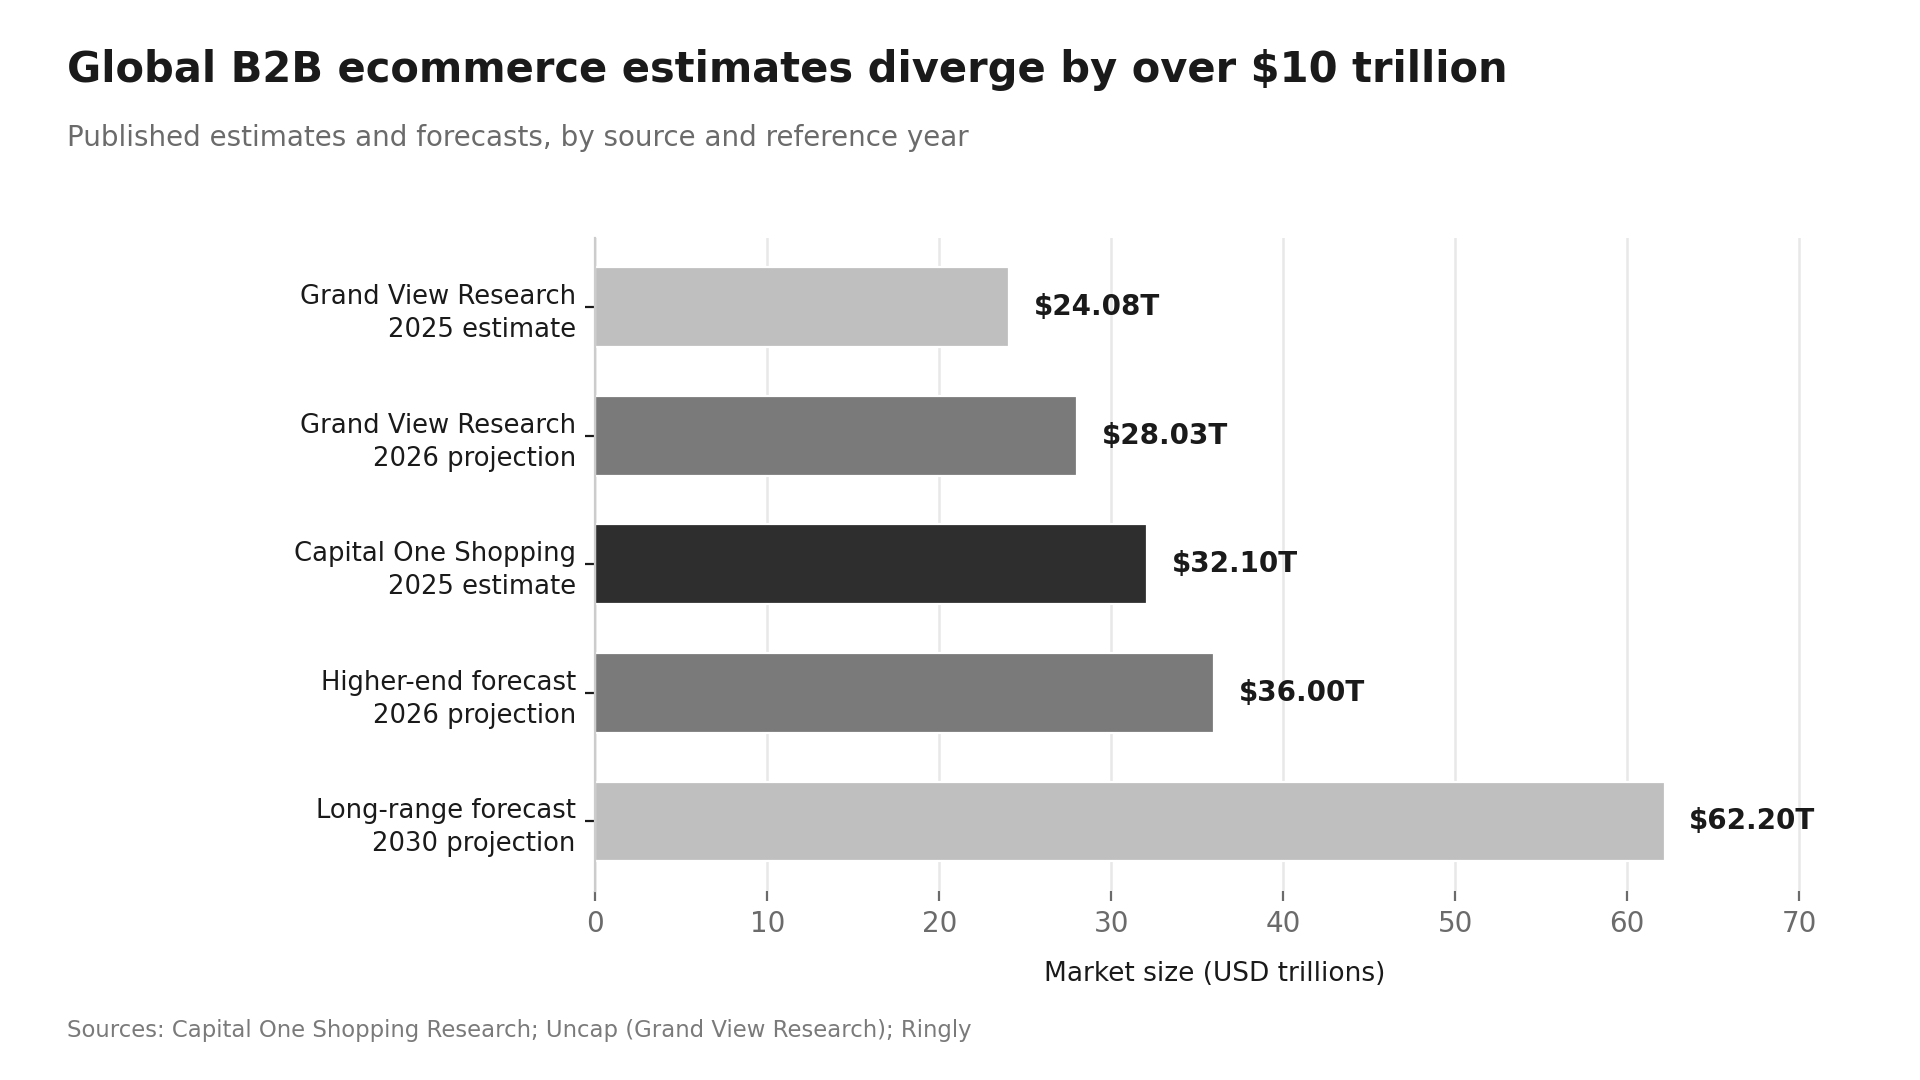
The headline market number depends entirely on which methodology you accept, so it is worth seeing the range before picking one.
- Global B2B ecommerce was worth an estimated $32.1 trillion in 2025, and the market grew 14.4% between 2024 and 2025 (source: Capital One Shopping Research).
- Global B2B GMV totaled $28.1 trillion in 2024, a 14.8% year-over-year increase (source: Capital One Shopping Research).
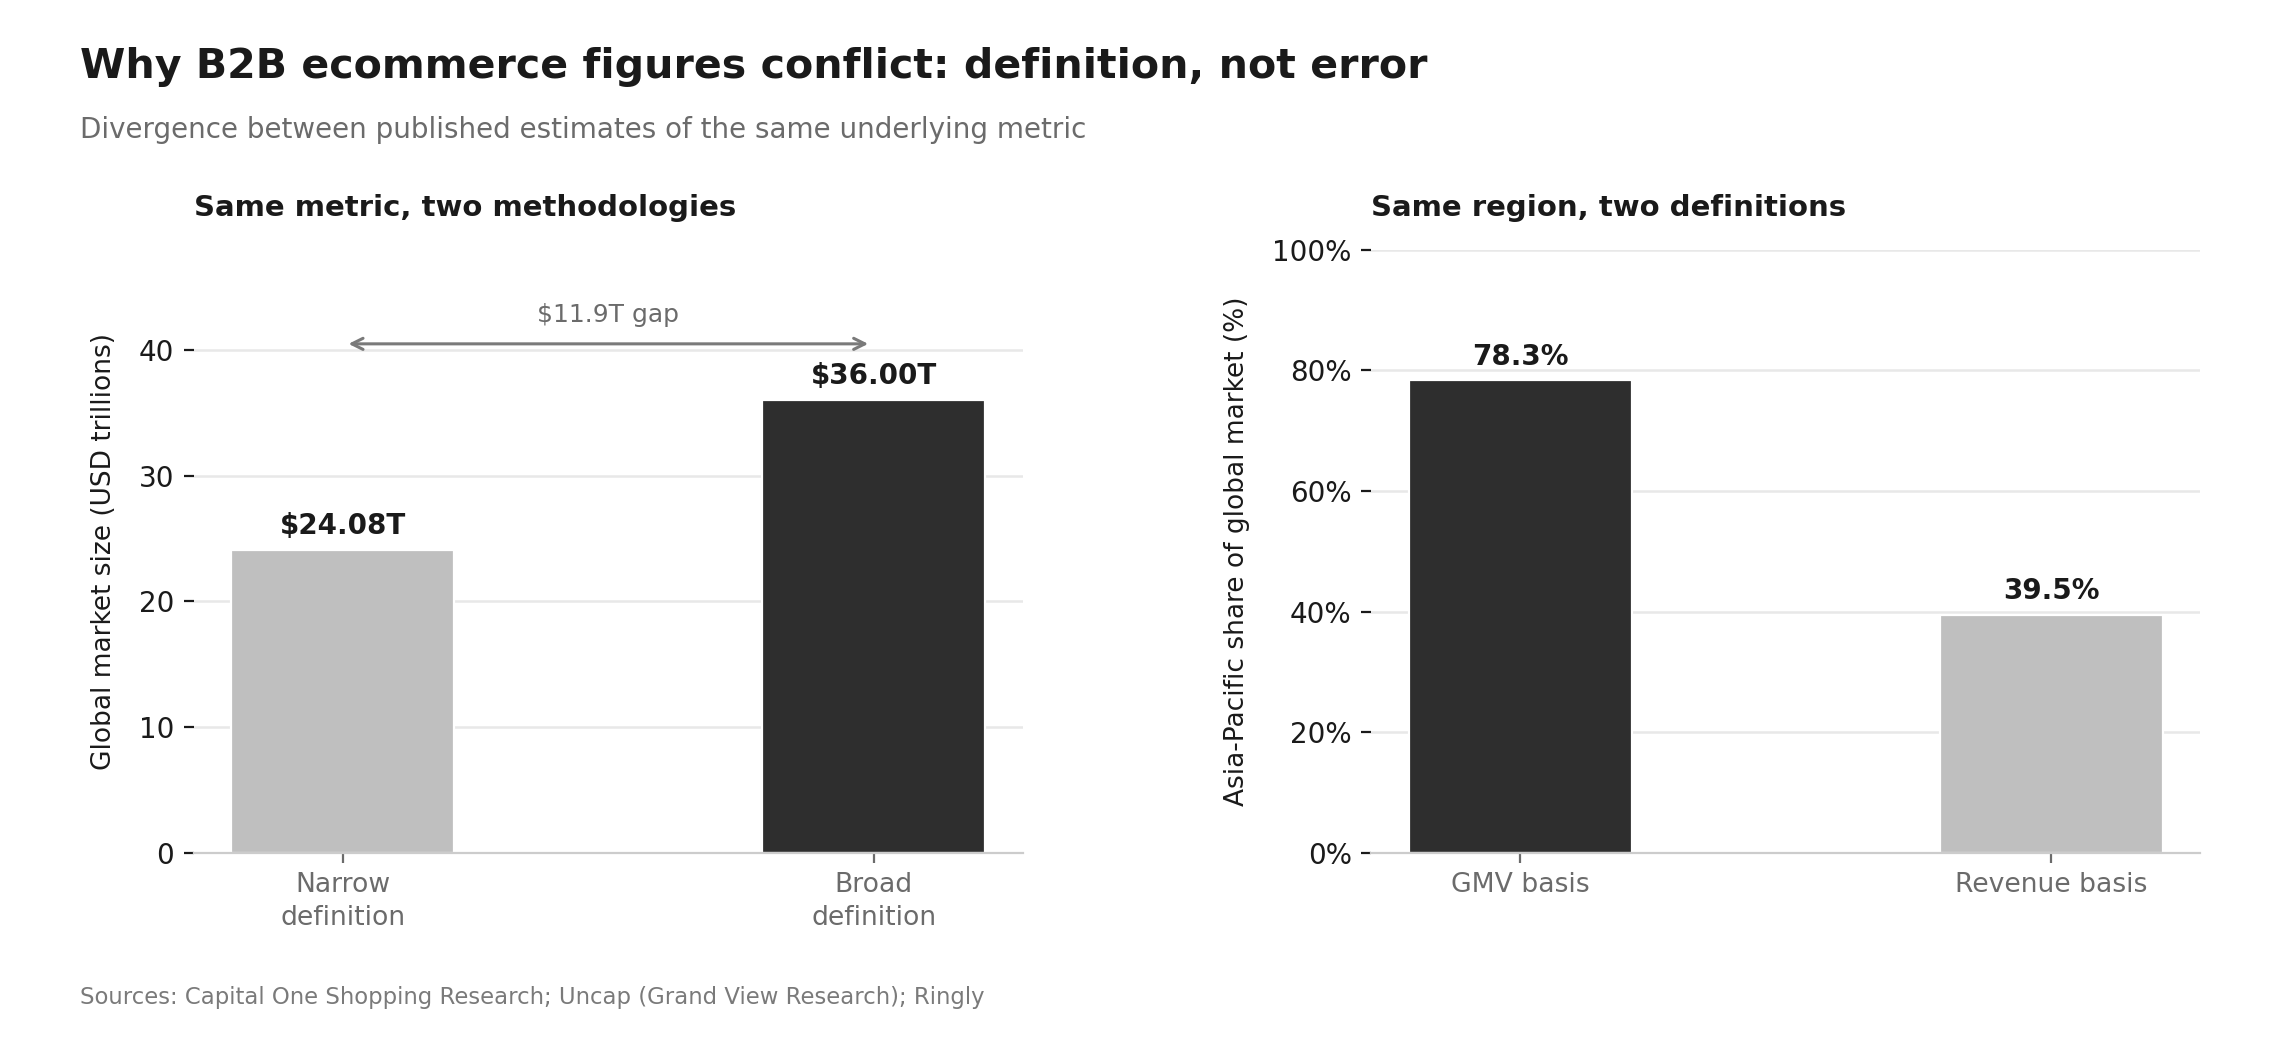
- One widely cited forecast puts the market at $36 trillion in 2026 at a 14.5% compound annual growth rate (source: Ringly).
- A more conservative estimate from Grand View Research places the 2025 market at $24.08 trillion, rising to $28.03 trillion in 2026 (source: Uncap).
- Longer-range projections point to $62.2 trillion by 2030 (source: Capital One Shopping Research).
- Between 2021 and 2024, global B2B GMV expanded 57.1%, an average CAGR of 16.2% (source: Capital One Shopping Research).
The spread between $24 trillion and $36 trillion is not a data error.
It reflects whether a source counts EDI and e-procurement volume, whether services are included, and whether GMV or net revenue is the unit.
For planning purposes, the growth rate matters more than the absolute figure, and every major source agrees it sits between 14% and 21%.
Why Digital Is Growing While Total B2B Demand Is Flat
The most important structural story in B2B ecommerce right now is the gap between total demand and digital demand.
- Total US B2B sales topped $15 trillion in 2025, but grew only 0.4% for the year (source: Digital Commerce 360).
- Over the same period, US B2B ecommerce grew 13% to $2.93 trillion (source: Digital Commerce 360).
- Quarterly 2025 data showed the stall clearly: Q1 rose 2.1%, Q2 declined 0.9%, and Q3 and Q4 came in at 0.1% and 0.3% (source: Digital Commerce 360).
- Distributor sales rose just 1% to $8.041 trillion in a comparable prior period, pressured by interest rates, tariffs and restrained corporate spending (source: Digital Commerce 360).
- About 12% of US B2B sales were transacted digitally in 2024, a share projected to reach 14.3% by 2028 (source: Scube Marketing).
Read together, these numbers say something specific: digital is not creating new B2B demand; it is absorbing existing demand from reps, phone orders, and manual purchase orders.
Suppliers gaining share in 2026 are taking it from their own offline channels and from slower competitors, not from a growing pie.
That is why our guide to B2B lead generation trends treats channel migration as a defensive priority, not just a growth play.
B2B Buyer Behavior Statistics
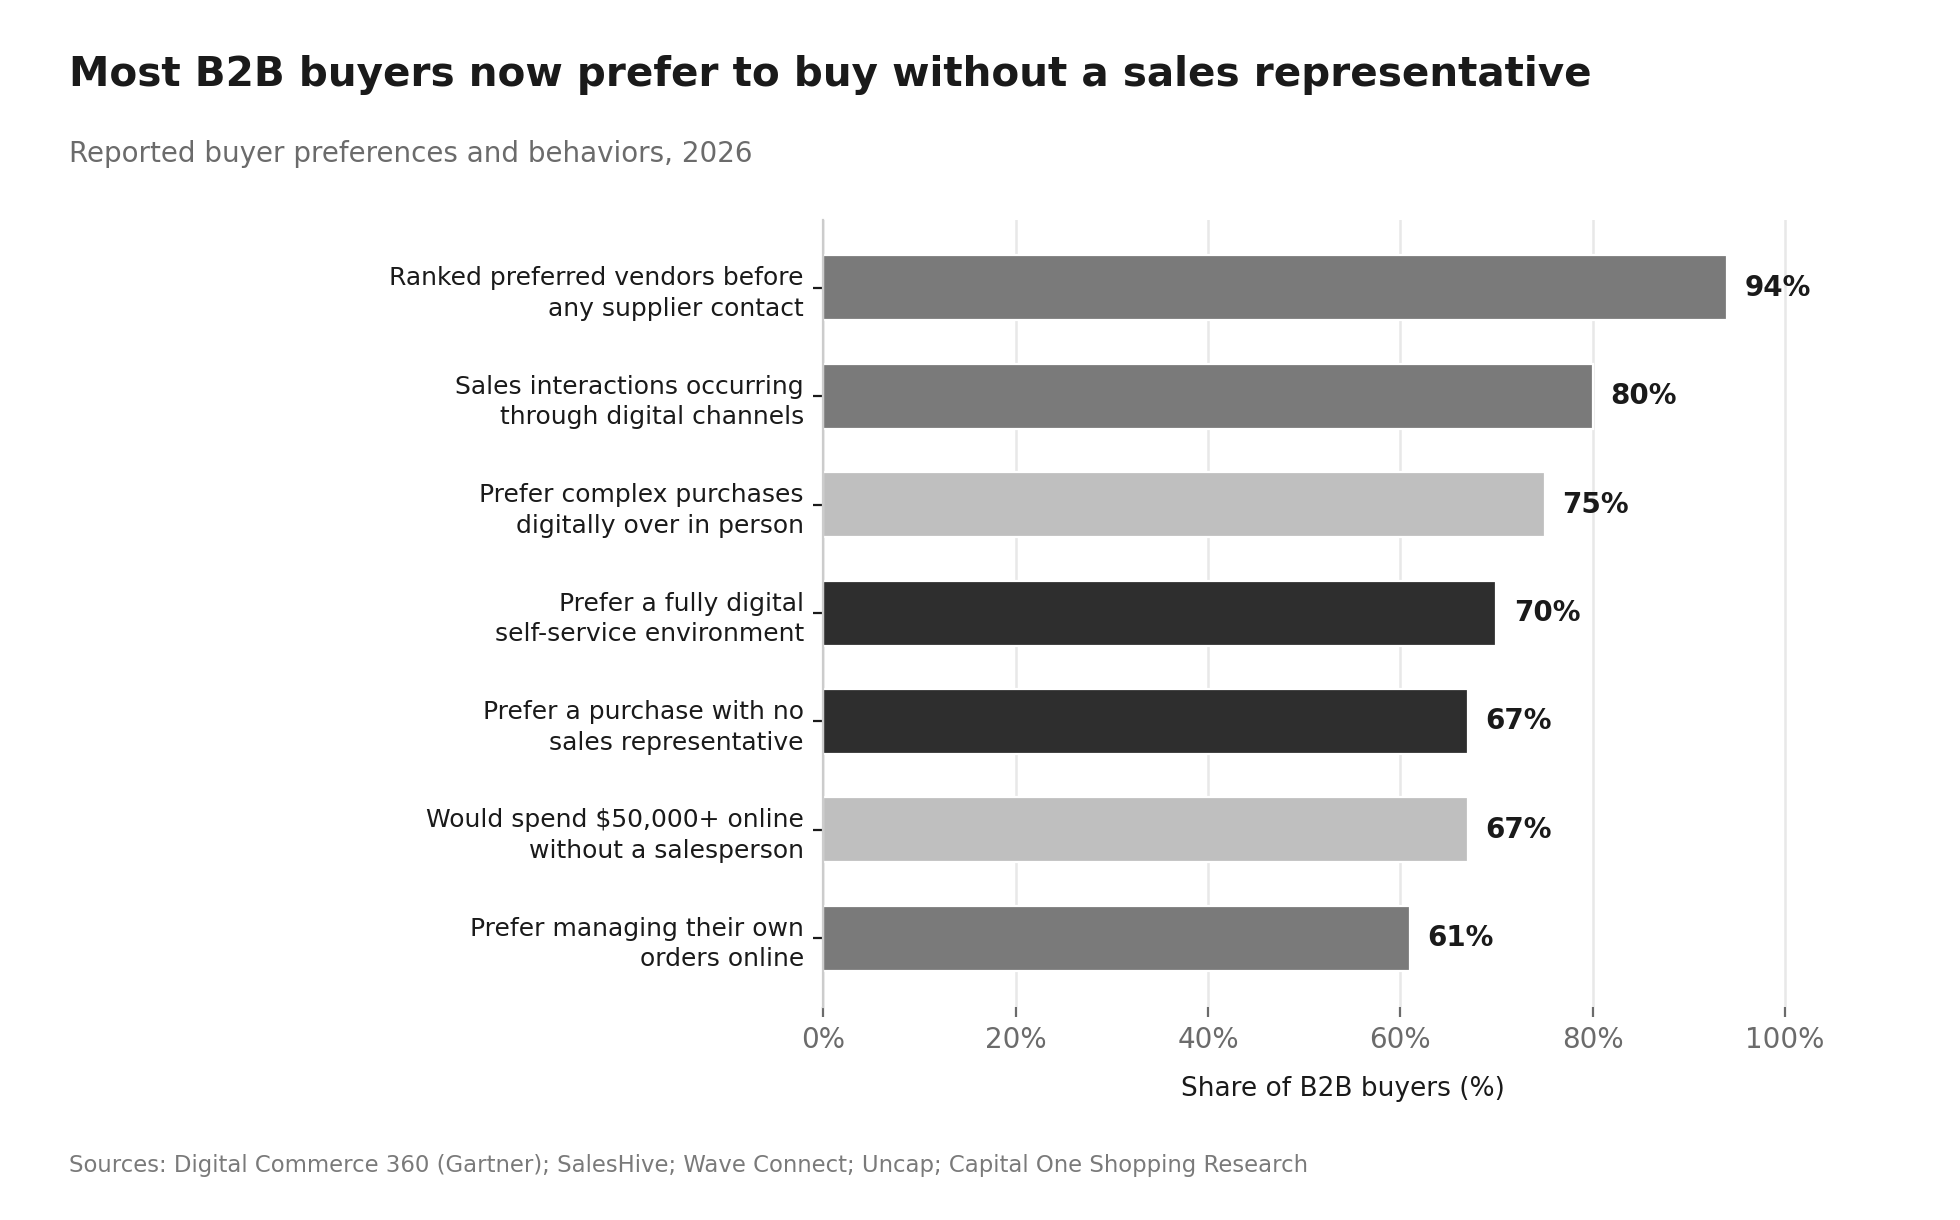
- 67% of B2B buyers prefer a representative-free purchase experience, and 45% used AI tools during a recent purchase (source: Digital Commerce 360).
- 70% prefer a fully digital self-service buying environment, yet 69% still involve a rep to validate AI-generated findings (source: SalesHive).
- 75% of buyers say they would rather make complex purchases digitally than in person (source: Wave Connect).
- 67% are willing to spend $50,000 or more online without speaking to a salesperson (source: Uncap).
- 61% would rather manage their own orders online than route them through a rep (source: Capital One Shopping Research).
- Buyers consult an average of 10 digital sources before deciding, and 74% use at least three channels during research (source: Brixon Group).
- 94% of buying groups had already ranked their preferred vendors before contacting any of them (source: SalesHive).
- Roughly 80% of B2B sales interactions now happen through digital channels (source: Wave Connect).
There is nuance the headline numbers hide. Buyers with high transaction frequency lean toward self-service platforms, while buyers placing infrequent large orders still prefer human interaction (source: McKinsey).
Preference is also stage-dependent: buyers avoid high-touch contact early when they only need general information, then want contextual help closer to a decision (source: Salsify).
Because most of those decisions are made by a group rather than an individual, this analysis of the 16-person buying committee is a useful companion read.
Channel Mix: Direct Sites, Marketplaces, and Procurement Systems
- US B2B marketplace ecommerce sales reached an estimated $378.7 billion in 2025 (source: Capital One Shopping Research).
- Amazon Business alone generated $83.1 billion in gross merchandise value in 2025, roughly 6.2% of total Amazon merchandise sales (source: Scube Marketing).
- US B2B marketplace sales rose 519% between 2021 and 2024, and represented about 14% of all US B2B sales in 2024 (source: Capital One Shopping Research).
- 88% of global B2B buyers make at least one marketplace purchase annually, and 59% complete more than a quarter of their purchases there (source: Uncap).
- The number of US vertical and industry-specific B2B marketplaces climbed from 75 to roughly 500 in five years, with 600 projected (source: Digital Commerce 360).
Despite that growth, marketplaces remain a minority of total volume.
Direct manufacturer and distributor sites still dominate B2B ecommerce by dollar value, with pure marketplace-model transactions accounting for a small single-digit share (source: Scube Marketing).
If you are weighing a marketplace strategy against a direct channel build, start with our guide to building and scaling a B2B marketplace.
Conversion Rate and Performance Benchmarks
B2B conversion behaves differently from B2C because logged-in repeat accounts and quote-based flows distort blended averages.
| Segment | Session-to-purchase conversion |
|---|---|
| B2B wholesale | ~2.6% |
| B2B distribution | ~2.4% |
| B2B manufacturing | ~2.2% |
| Industrial equipment | ~1.8% |
Platform-level 2026 data puts wholesale at roughly 2.6%, distribution at 2.4%, manufacturing at 2.2% and industrial equipment at 1.8% on a purchase-based definition (source: Elogic Commerce).
Additional benchmarks worth holding onto:
- The defensible B2B range for session-to-purchase conversion is 1.8% to 3.0%, and most published "B2B benchmarks" actually measure lead actions rather than completed orders (source: Elogic Commerce).
- On repeat-order pathways for onboarded accounts, single-session conversion can exceed 10% (source: Elogic Commerce).
- Sites consistently above 3.0% usually owe that to a high share of logged-in repeat buyers, not better acquisition (source: Elogic Commerce).
- Q1 2026 portfolio data showed conversion falling 22% year over year while sessions rose 50%, a dilution pattern rather than a performance failure (source: Elogic Commerce).
- Cross-industry lead-based B2B conversion medians sit near 2.9%, which is not comparable to purchase-based figures (source: Elogic Commerce).
The practical takeaway: segment authenticated and anonymous traffic before benchmarking anything. A single blended number will either flatter or panic you.
Personalization is where most of the recoverable upside sits, which is covered in our breakdown of ecommerce personalization.
AI and Agentic Commerce Statistics in B2B
This is the fastest-moving category in the dataset, and the numbers have changed materially in the last six months.
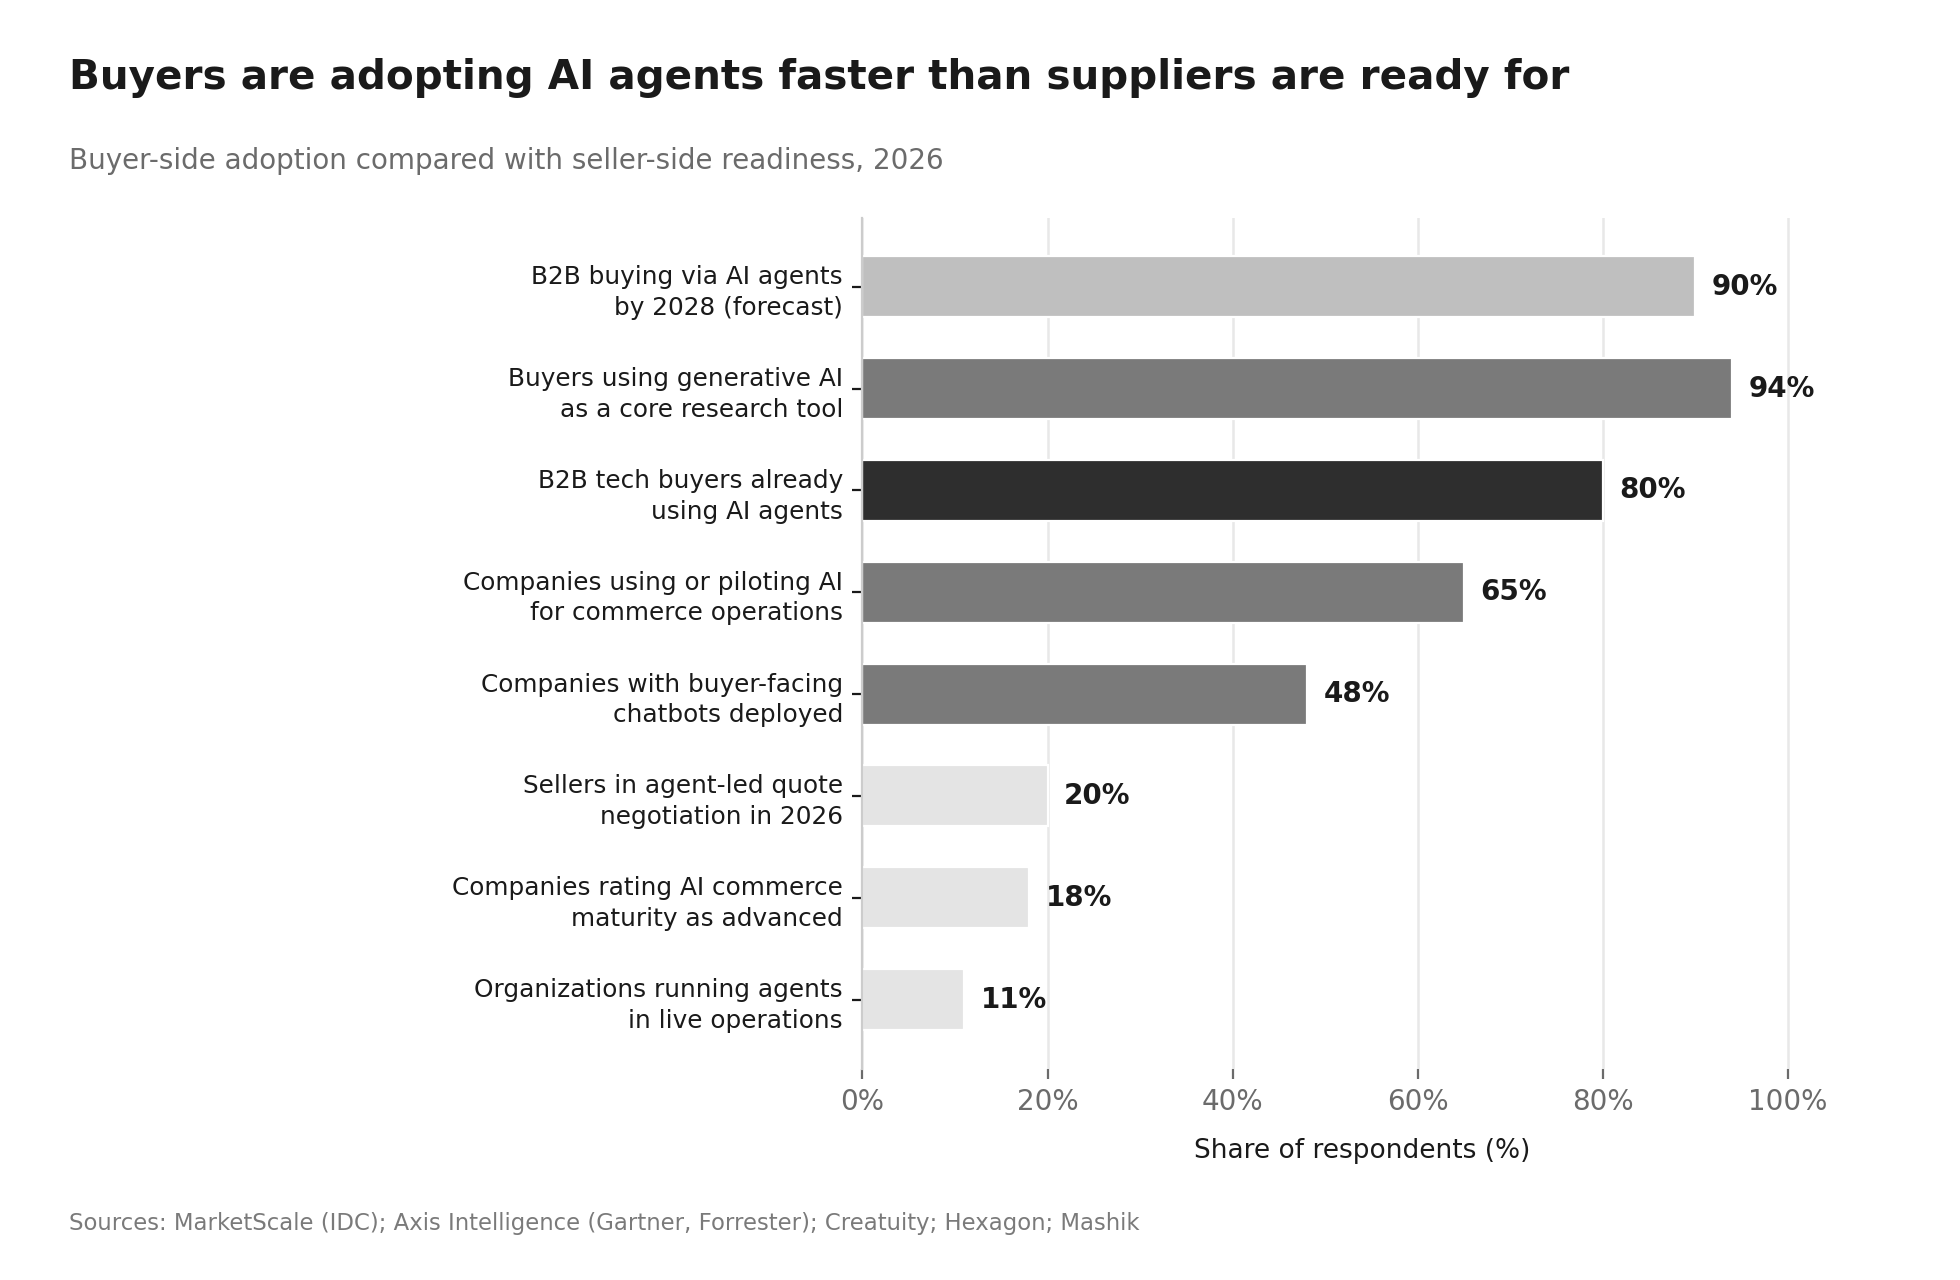
- 80% of B2B technology buyers already use AI agents as part of their purchasing process, per IDC research published in August 2026 (source: MarketScale).
- Gartner forecasts that 90% of B2B buying will run through AI agents by 2028, representing more than $15 trillion in annual spend (source: Axis Intelligence).
- 94% of B2B buyers use generative AI as a core research tool, according to Forrester's 2026 State of Business Buying survey of roughly 18,000 buyers (source: Axis Intelligence).
- Forrester expects only 20% of B2B sellers to participate in agent-led quote negotiation during 2026 (source: Hexagon).
- Agents are expected to handle 60% to 70% of end-to-end transactional procurement, starting with tail spend and standardized sourcing (source: SupplyChainBrain).
- 65% of B2B companies are using or piloting AI for commerce operations, and 48% have deployed buyer-facing chatbots or virtual assistants (source: Creatuity).
- Only 18% of B2B companies describe their AI commerce maturity as advanced (source: Creatuity).
- Roughly 79% of organizations claim agent adoption, but only about 11% actually run agents in live operations, and more than 40% of agentic projects are expected to fail by 2027 (source: Mashik).
The asymmetry is the point.
Buyers are further along than sellers, and procurement agents query pricing, promotions, inventory and delivery estimates in real time, meaning suppliers without API-exposed data are effectively invisible to those flows (source: Axis Intelligence).
If that describes your catalog, read our pieces on agentic commerce readiness and making your checkout AI-agent-ready, plus this external look at product feed optimization for AI shopping agents and how agentic storefronts are now on by default.
Regional Distribution of B2B Ecommerce
- Asia-Pacific accounts for roughly 78.3% of global B2B ecommerce GMV (source: Capital One Shopping Research).
- Grand View Research puts the Asia-Pacific share lower, at 39.5%, using a different market definition (source: Uncap).
- Europe's B2B ecommerce market was worth an estimated $2.08 trillion in 2025, about 6.5% of the global total, after growing 51.9% from 2020 to 2023 (source: Capital One Shopping Research).
- The US B2B ecommerce market was estimated at $10.1 trillion in 2025 on a broad definition, projected to reach $11.4 trillion by 2030 (source: Capital One Shopping Research).
- The US market is projected to compound at 18.5% between 2026 and 2033 (source: Uncap).
- 71% of B2B companies now offer fully digital service options (source: Capital One Shopping Research).
Technology and Platform Statistics
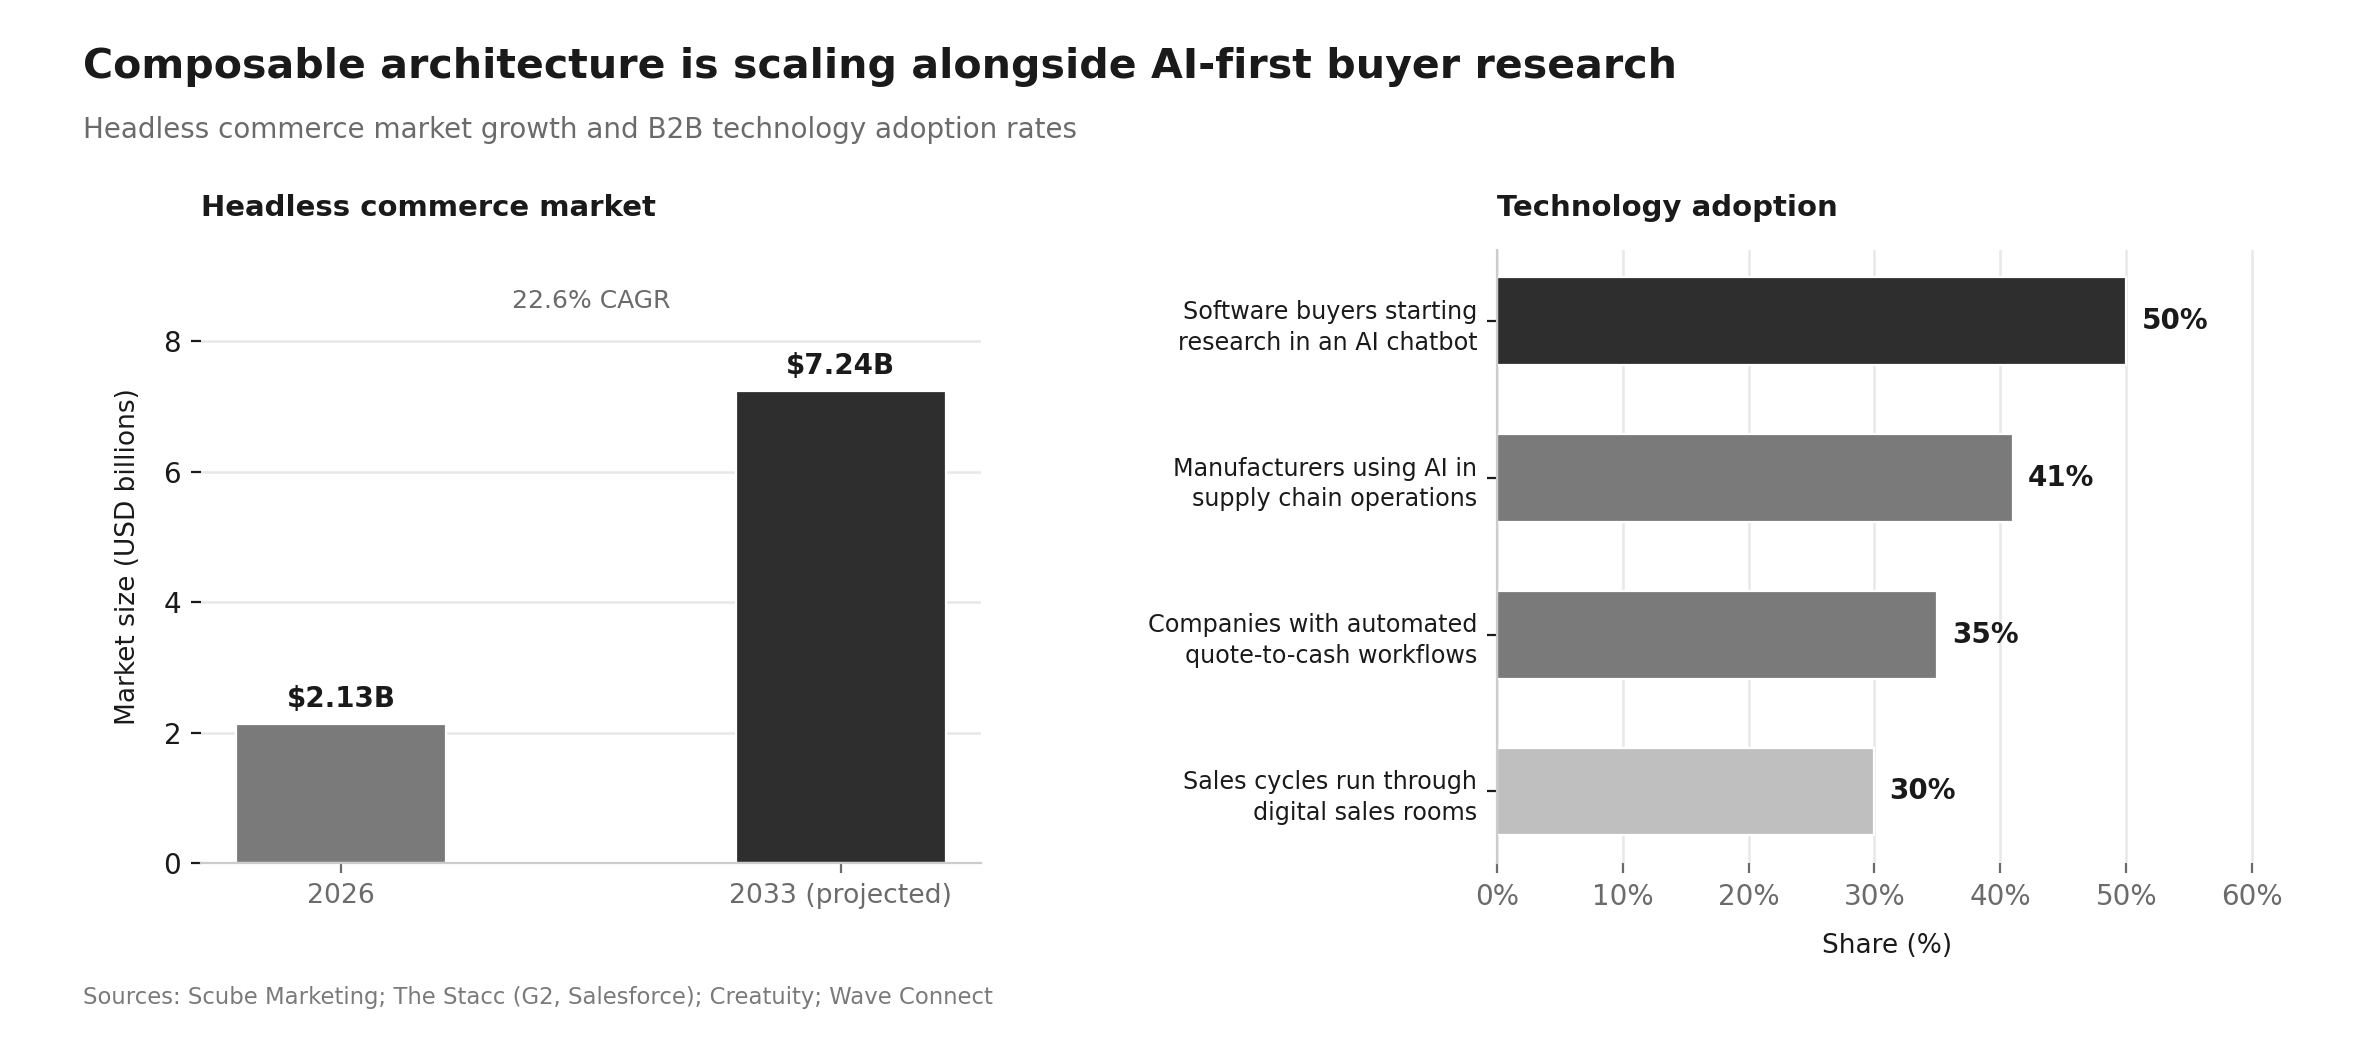
- The global headless commerce market is estimated at $2.13 billion in 2026 and projected to reach $7.24 billion by 2033, a 22.6% CAGR (source: Scube Marketing).
- 35% of B2B companies have automated quote-to-cash workflows, cutting cycle times by 40% to 60% (source: The Stacc).
- 41% of B2B manufacturers have implemented AI somewhere in supply chain operations (source: Creatuity).
- Half of B2B software buyers now begin research inside an AI chatbot rather than a search engine, according to G2 (source: The Stacc).
- 30% of B2B sales cycles are expected to be managed through digital sales rooms in 2026 (source: Wave Connect).
Architecture decisions increasingly determine whether a supplier can expose real-time data to buyer agents.
Composable and headless setups make that straightforward, and this roundup of the best headless CMS platforms for 2026 is a reasonable starting point.
Order-capture surfaces are also broadening beyond the browser, as covered in this external guide to voice commerce platforms for B2B procurement teams.
B2B Ecommerce Salary Benchmarks
Compensation data shows where employers are actually placing bets.
The variance between sources is wide because job titles cover very different scopes of profit and loss ownership.
| Role | Reported range or average |
|---|---|
| Ecommerce manager (Glassdoor average) | $107,260, typical range $80,535 to $144,413 |
| Ecommerce manager (ZipRecruiter average) | $77,129, majority $58,000 to $96,000 |
| Digital ecommerce manager (Salary.com) | $113,090, range $94,975 to $143,002 |
| Director of ecommerce (base, recruiter data) | $130,000 to $185,000 |
| VP or director, Amazon channel | $150,000 to $220,000 base |
| VP or director, AI and agentic commerce | $170,000 to $260,000 base |
| Retail media manager | $90,000 to $130,000 base |
- Ecommerce managers average $107,260 in the US, with 90th percentile earners reported up to $187,254 (source: Glassdoor).
- ZipRecruiter puts the same title far lower at $77,129, illustrating how much title definition matters (source: ZipRecruiter).
- Digital ecommerce manager averages $113,090, or about $54 per hour (source: Salary.com).
- Director of ecommerce is the most in-demand title of 2026, with base salaries of $130,000 to $185,000 (source: eCommerce Placement).
- AI and agentic commerce leadership is the highest-paid emerging function, at $170,000 to $260,000 base for VP and director roles (source: eCommerce Placement).
- Head of Amazon compensation rose more than 15% year over year (source: eCommerce Placement).
- Manufacturing pays ecommerce managers a median total of $117,377, second only to telecommunications at $124,735 (source: Glassdoor).
- Scope of profit and loss responsibility is the most reliable salary predictor at leadership level, with a director at a $50 million business typically earning 15% to 25% less than the same title at a $500 million business (source: eCommerce Placement).
For broader context on where these roles sit against other functions, see our hiring statistics report.
What Separates Leaders From Laggards
The performance gap between digitally mature suppliers and everyone else is now the widest part of the dataset.
- 60% of self-identified market leaders reported double-digit revenue growth in 2025, against 21% of laggards (source: McKinsey).
- 90% of leaders reported improved sales effectiveness, versus 55% of lower-performing peers (source: McKinsey).
- Teams combining personalized customer experiences with generative AI are 1.7 times more likely to gain market share (source: Scube Marketing).
- Nine in ten B2B companies plan to keep hybrid sales models, making hybrid the default structure for 2026 (source: Wave Connect).
- Inside sales reps cover four times more prospects at half the cost of outside reps (source: Wave Connect).
- The average B2B lead response time of 42 hours sits far outside the roughly 10-minute window buyers expect (source: Wave Connect).
Buyers are also more willing to switch suppliers than in prior cycles, and advantage now accrues to sellers who can deliver strong ecommerce capability and orchestrate experience across every channel (source: McKinsey).
Two useful external companions here are this piece on buyer enablement and this overview of marketing AI tools for B2B ecommerce brands targeting wholesale buyers.
How to Read Conflicting B2B Ecommerce Data
Three cautions apply to almost every figure in this report:
- First, market size estimates diverge by more than $10 trillion because sources disagree on whether EDI, e-procurement and services count as ecommerce.
- Second, several widely repeated predictions, including the frequently cited 80% digital interaction figure, originated in forecasts published years earlier and have been confirmed directionally rather than re-measured (source: Omnibound).
- Third, conversion benchmarks are only comparable when the denominator is stated, since session-based, visitor-based and lead-based definitions produce very different numbers (source: Elogic Commerce).
Treat every figure here as a directional signal, cite the methodology alongside the number, and benchmark your own performance against your own trajectory before comparing it to an industry average.
Conclusion
B2B Centr publishes this data so B2B operators can allocate budget against measured buyer behavior rather than vendor narrative.
The picture for 2026 is consistent across sources: total B2B demand is close to flat, digital channels are growing at 13% or better, roughly two thirds of buyers now prefer to transact without a representative, and AI agents are moving from research tool to transaction participant faster than most suppliers have prepared for.
Marketplaces are expanding quickly but still sit behind direct manufacturer and distributor sites in absolute volume.
Conversion benchmarks reward account onboarding and repeat-order pathways more than acquisition spend.
Compensation data confirms where the demand is, with agentic commerce leadership now the highest-paid emerging function in the field.
Read Next
FAQs
1. What is the B2B ecommerce market size in 2026?
The B2B ecommerce market size in 2026 is estimated between $28.03 trillion and $36 trillion globally, depending on methodology, following a 2025 figure of roughly $32.1 trillion and annual growth of about 14.4% (source: Capital One Shopping Research).
2. How many B2B buyers prefer to buy without a sales rep?
The share of B2B buyers who prefer to buy without a sales rep is 67%, based on a Gartner survey of 646 buyers released in March 2026, with 70% preferring a fully digital self-service environment (source: Digital Commerce 360).
3. What is a good B2B ecommerce conversion rate?
A good B2B ecommerce conversion rate is 2.0% to 2.5% on blended session-to-purchase traffic, with anything consistently above 3.0% usually driven by a high proportion of logged-in repeat accounts (source: Elogic Commerce).
4. How much B2B buying will run through AI agents?
The amount of B2B buying expected to run through AI agents is 90% by 2028, representing more than $15 trillion in annual spend, while 80% of B2B technology buyers already use agents in their purchasing process today (source: Axis Intelligence).
5. What is the average salary for a B2B ecommerce manager?
The average salary for a B2B ecommerce manager is $107,260 in the US, with a typical range of $80,535 to $144,413 and director-level base pay reaching $130,000 to $185,000 (source: Glassdoor).
Disclaimer: This content is provided for informational purposes only and does not constitute legal, financial, or compliance advice. Protocol versions, governance arrangements, and partner counts cited here reflect publicly announced milestones as of August 2026 and are moving quickly. Adoption figures come from vendor and foundation announcements with differing methodologies and should be treated as directional signals rather than guaranteed outcomes.