

Venture investors poured $42 billion into just over 1,500 startups worldwide in August 2026, up 122% year over year (source: Crunchbase).
B2B Centr publishes the benchmark data that operators use to price decisions rather than guess at them.
The 2026 startup economy is defined by a split: record capital at the top, brutal filtering at the bottom, and a widening gap between AI-adjacent companies and everyone else.
This report compiles 100+ verified statistics on funding, formation, failure, valuations, unicorns, exits, hiring, salaries and founder demographics, each linked to its source.
Key Takeaways
- Global venture funding hit a record $510 billion in H1 2026.
- Over 70% of Q2 2026 startup capital went to AI companies.
- Roughly 49% of US businesses fail within five years.
- 195 companies became unicorns in H1 2026 alone.
- Median startup CEO salary in 2026 is $159,000.
The 2026 Startup Market at a Glance
The headline numbers show a market fully recovered in dollar terms but far narrower in deal terms.
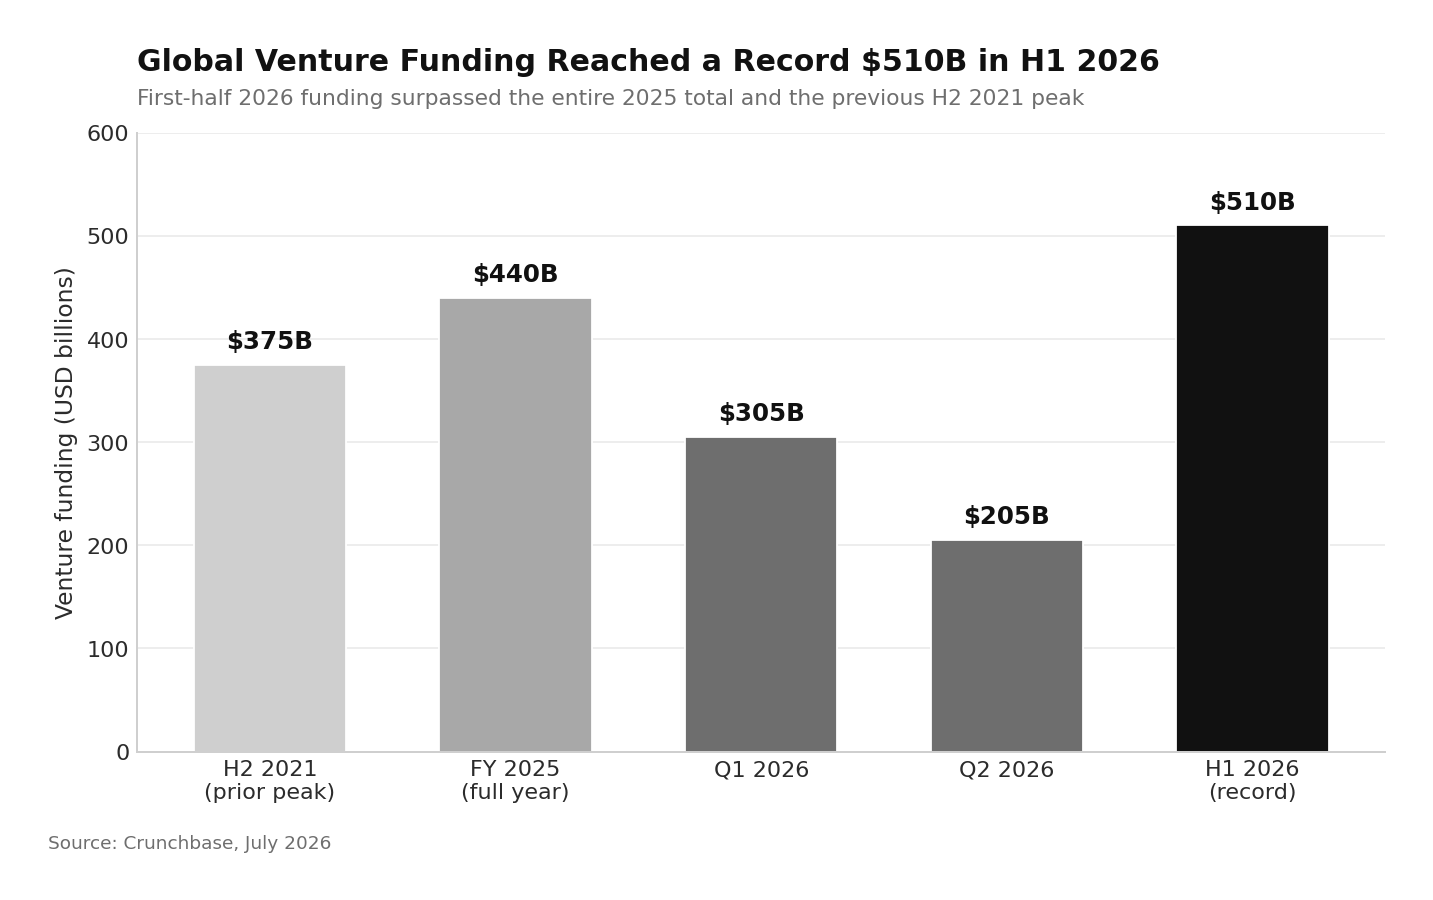
- Global venture funding reached a record $510 billion in H1 2026 (source: Crunchbase).
- That surpassed the $440 billion invested across all of 2025 (source: Crunchbase).
- The previous half-year peak was $375 billion in H2 2021 (source: Crunchbase).
- Q1 2026 saw $305 billion invested, the largest quarter on record (source: Crunchbase).
- Q2 2026 brought $205 billion across more than 5,000 startups (source: Crunchbase).
- OpenAI and Anthropic took $217 billion, or 43% of H1 funding (source: Crunchbase).
- Anthropic alone raised $65 billion in Q2, near a third of the global total (source: Crunchbase).
- 16 companies raised billion-dollar rounds in Q2, totaling $108.6 billion or 53% of the quarter (source: Crunchbase).
- Seven of those 16 were frontier AI labs (source: Crunchbase).
- Two-thirds of Q2 capital went to US companies, down from 83% in Q1 (source: Crunchbase).
- In Q1 2026, OpenAI, Anthropic, xAI and Waymo raised $188 billion combined, nearly 65% of the quarter (source: Crunchbase).
- AI's share of global funding hit 80% in Q1 2026 (source: Crunchbase).
- Databricks raised $5 billion at a $190 billion valuation, August's largest deal (source: Crunchbase).
Startup Formation Statistics
New business applications remain historically elevated while formation projections have flattened.
- US business applications totaled 496,443 in February 2026 (source: US Census Bureau).
- That was a 5.8% decrease from January 2026 (source: US Census Bureau).
- Projected formations within four quarters were 28,994 for February 2026 (source: US Census Bureau).
- June 2026 projected formations rose to 29,741, up 0.7% month over month (source: US Census Bureau).
- Only 0.05% of startups ever receive venture capital (source: SEOScaleUp).
For wider context, see our small business statistics breakdown.
Regional Startup Funding Statistics
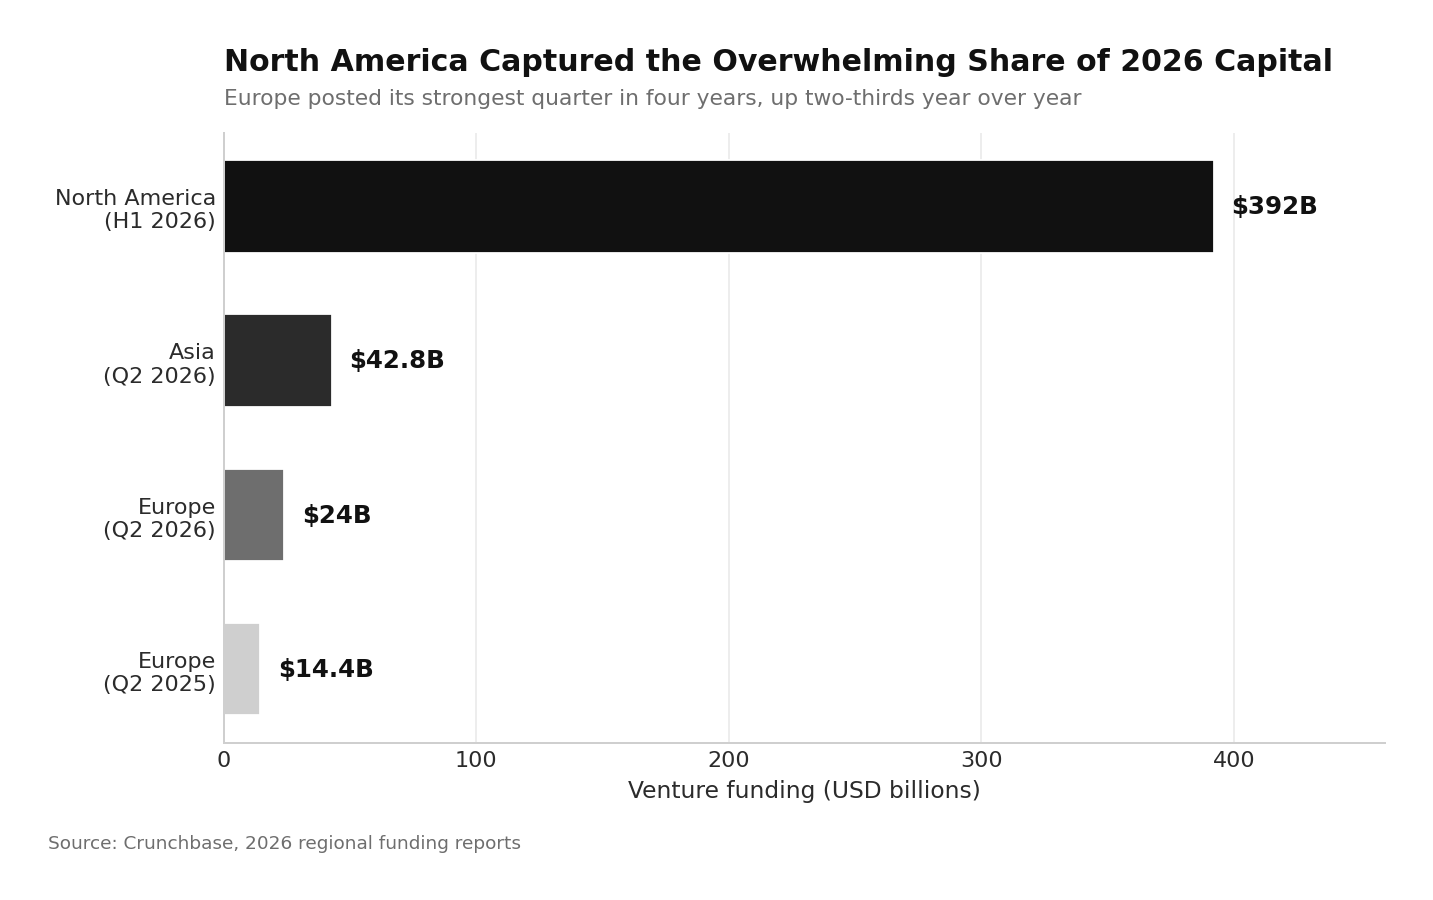
- North American startups raised $392 billion in H1 2026 (source: Crunchbase).
- Europe raised $24 billion in Q2 2026, its strongest quarter in four years (source: Crunchbase).
- That was two-thirds above Q2 2025's $14.4 billion (source: Crunchbase).
- Asian startups raised $42.8 billion in Q2, the highest in over three years (source: Crunchbase).
- AI captured over 60% of Asian Q2 funding, just above $26 billion (source: Crunchbase).
- DeepSeek's $7.4 billion round led Asia (source: Crunchbase).
- 88% of H1 AI venture dollars went to US companies, $319 billion of $362 billion (source: The Agent Report).
Startup Funding by Stage
Stage-level data reveals where the real bottleneck sits.
- Late-stage funding totaled $134 billion in Q2 2026, up 141% year over year (source: Crunchbase).
- 91 companies globally raised Series A or B rounds of $100 million or more in Q2 (source: Crunchbase).
- Global seed funding totaled $12 billion in Q2 2026 (source: Crunchbase).
- $2.8 billion of that went to seed rounds of $100 million and over (source: Crunchbase).
- $5 billion went to seed rounds of $10 million and under (source: Crunchbase).
- Carta recorded $30.4 billion in platform funding in Q1 2026 (source: Carta).
- Over 60% of Carta Q1 capital went to AI companies (source: Carta).
- Within SaaS, 83% of capital went to AI startups (source: Carta).
Valuation and Dilution Statistics
Terms swung back toward founders, but the bar for a priced round rose faster.
- The down-round rate fell to 11.4% in Q1 2026, matching 2019 levels (source: Carta).
- That compares with a 22% peak in 2023 (source: Causo).
- Series B pre-money valuations rose 17.2% since Q1 2025 (source: Carta).
- Median Series A post-money valuation is roughly $75 million to $85 million (source: PMF).
- Median Series A raise is $13 million to $15 million, up from $8 million to $10 million (source: PMF).
- Median ARR needed for a Series A is around $3.5 million, versus roughly $1 million a few years ago (source: PMF).
- A typical seed round is $4 million to $5 million on a $20 million to $22 million post-money (source: PMF).
- AI infrastructure seed rounds are pricing at $160 million to $200 million post-money (source: PMF).
- AI foundational model startups can raise Series A at a $300 million median valuation (source: Carta).
- Median seed dilution is approximately 19% to 20% (source: Stealth Agents).
- Series A dilution sits around 18% to 20% (source: Stealth Agents).
Benchmark these against SaaS CAC payback data and B2B SaaS CAC benchmarks.
Seed to Series A Graduation Statistics
The seed-to-A gap remains the hardest filter in the market.
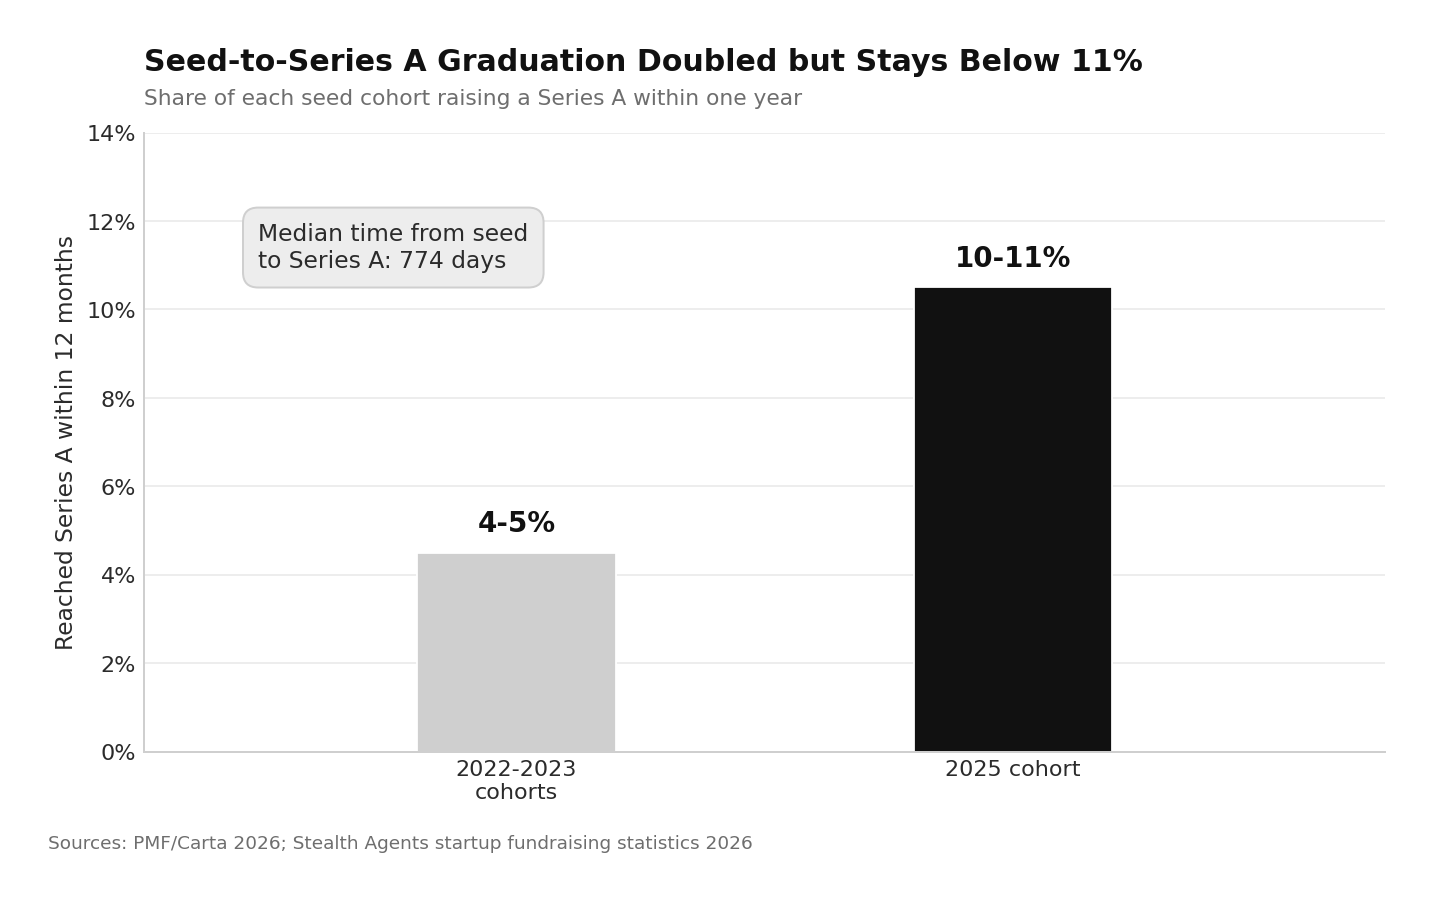
- 10% to 11% of the 2025 seed cohort graduated to Series A within one year (source: PMF).
- That compares with 4% to 5% for the 2022 and 2023 cohorts (source: PMF).
- Only 15.4% of 2022-cohort seed companies raised a Series A within two years (source: Stealth Agents).
- Median seed-to-Series A time stretched to 774 days, nearly double the 420 days of 2021 (source: Stealth Agents).
- Roughly 60% of pre-seed funded startups never reach Series A (source: Growth List).
Startup Failure and Survival Statistics
Failure rates vary enormously depending on which population is measured.
- 20.4% of new US private-sector businesses fail within their first year (source: Founder Reports).
- 38.6% fail within three years (source: Founder Reports).
- 49.4% fail within five years (source: MakerStations).
- 65.3% fail within ten years (source: MakerStations).
- 67.7% survive their first two years (source: Review42).
- Around 90% of venture-scale innovative startups fail over their lifetime (source: MakerStations).
- 75% of venture-backed startups never return cash to investors (source: MakerStations).
- Bootstrapped startups show 58% five-year survival versus 32% for venture-backed (source: SEOScaleUp).
- The information sector records a 39.2% three-year failure rate (source: Founder Reports).
- No market need causes 42% of startup shutdowns (source: MakerStations).
- Running out of cash causes 29% (source: MakerStations).
- Those two causes together explain 71% of failures (source: MakerStations).
- Tech startups fail at 63% within five years (source: MakerStations).
- Blockchain and crypto startups fail at roughly 95% (source: Review42).
- Healthcare technology and e-commerce both sit near 80% (source: Review42).
- Only 28% of software companies reach $100 million in revenue (source: MakerStations).
- 97% of tech startups never reach $1 billion in revenue (source: MakerStations).
Validating demand early is the best defence against that 42% figure, which is why product-market fit remains the core early-stage discipline.
Unicorn Statistics
Unicorn creation moved from recovery mode into a much faster cycle.
- 195 companies joined the Crunchbase Unicorn Board in H1 2026 (source: Crunchbase).
- That already exceeds the 193 minted across all of 2025 (source: Crunchbase).
- 250 companies reached unicorn status through August 15, 2026 (source: Crunchbase).
- H1 unicorns added roughly $440 billion in value, 5% of the board's total (source: Crunchbase).
- Those companies have raised $80 billion over their lifetimes (source: Crunchbase).
- The US produced 110 new unicorns in H1, or 56% of the total (source: Plox).
- China ranked second with 38, up from 10 in all of 2025 (source: Plox).
- By continent: North America 115, Asia 50, Europe 27 (source: Plox).
- DeepSeek is the most valuable new unicorn at $50 billion, followed by OKX at $25 billion (source: Plox).
- 40 companies joined in July 2026, the highest monthly count in over four years (source: Crunchbase).
- 34 joined in June, adding more than $110 billion in value (source: Crunchbase).
- 10 of June's new unicorns were AI labs, collectively valued at $65 billion (source: Crunchbase).
- There are 935 unicorns based in the US (source: Crunchbase).
- 19 H1 unicorns doubled their valuation on follow-on rounds within six months or less (source: Crunchbase).
- Approximately 1% of startups ever reach unicorn status (source: Growth List).
See also this breakdown of the biggest startups in the US.
Startup Exit Statistics
Liquidity returned in force after a four-year drought.
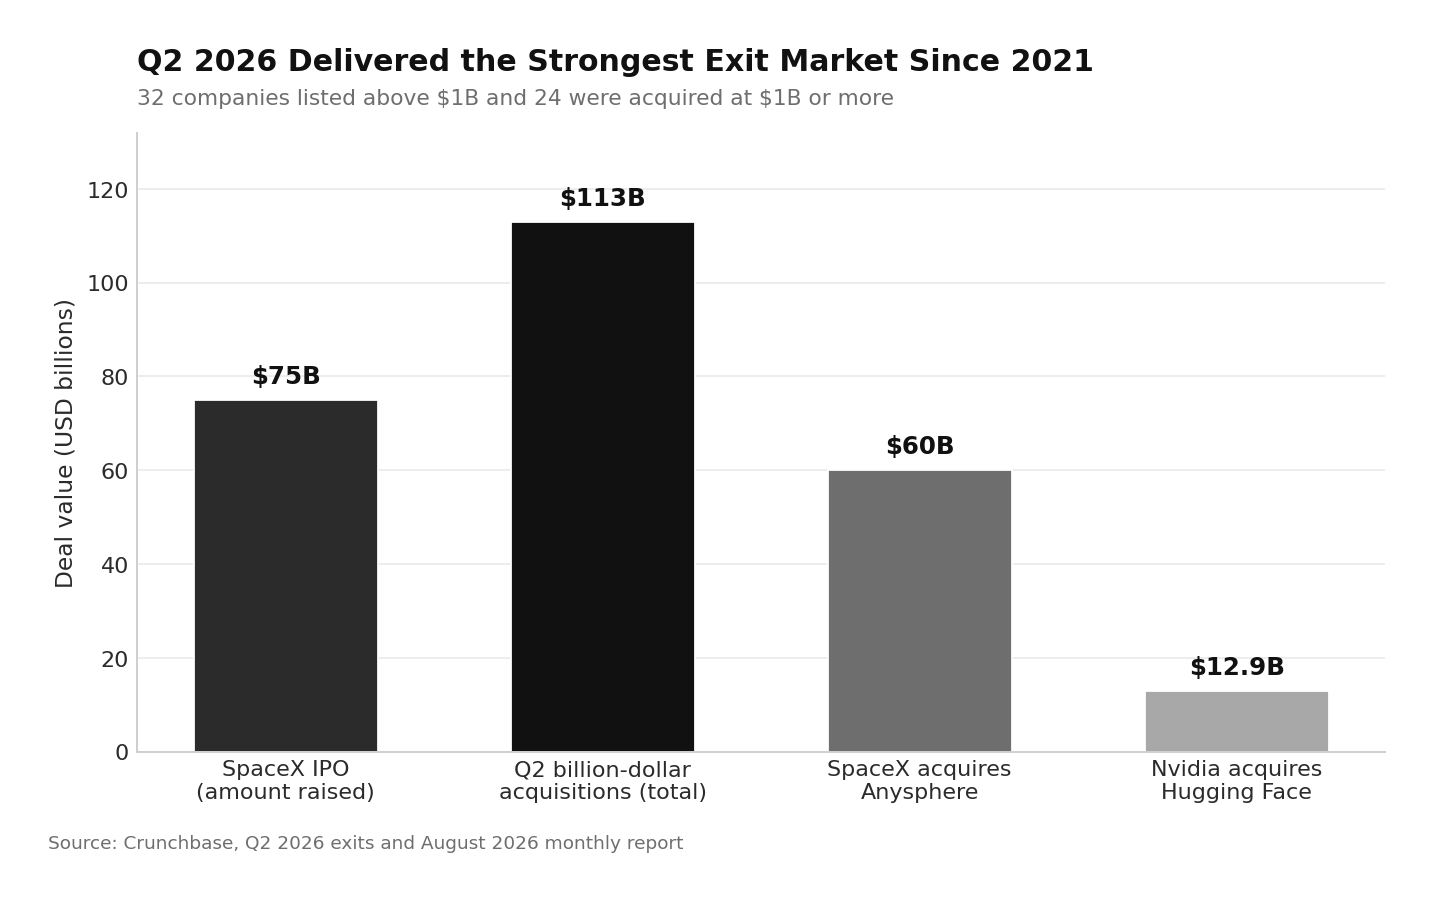
- Q2 2026 produced the strongest exit market since the 2021 boom (source: Crunchbase).
- 32 companies went public above $1 billion in Q2 (source: Crunchbase).
- SpaceX listed at a $1.77 trillion valuation, raising $75 billion (source: Crunchbase).
- SpaceX then moved to acquire Anysphere, maker of Cursor, for $60 billion (source: Crunchbase).
- 24 companies were acquired at $1 billion or more in Q2, totaling $113 billion (source: Crunchbase).
- Nvidia moved to acquire Hugging Face for $12.9 billion (source: Crunchbase).
- Bending Spoons moved to acquire Airtable for around $1.3 billion (source: Crunchbase).
- Unitree Robotics IPO'd at roughly $9 billion and rose 460% on day one (source: Crunchbase).
AI and Sector Statistics
AI is no longer a sector inside the startup market. It is the market.
- Over 70% of Q2 2026 global startup capital went to AI companies, up from under 50% a year earlier (source: Crunchbase).
- Physical AI startups raised $47.4 billion across 521 deals in H1 2026 (source: Crunchbase).
- That is nearly 4x the $12 billion across 470 deals in H2 2025 (source: Crunchbase).
- Cybersecurity startups raised $10.6 billion in H1 2026 (source: Crunchbase).
- Cybersecurity Q2 funding was $4.4 billion, down around 30% quarter over quarter (source: Crunchbase).
Accelerator and Founder Composition Statistics
Y Combinator batch data is the clearest leading indicator of where founders build next.
- YC's Winter 2026 batch listed 214 companies across nine categories (source: Extruct AI).
- 3x more W26 companies reached $1 million annualized revenue than in W25 (source: Extruct AI).
- 36 solo founders made up 17% of the W26 batch (source: Extruct AI).
- More than 230 startups joined YC's Summer 2026 batch (source: New Economies).
- Industrials rose to 23% of the S26 batch, up from 12.8% (source: New Economies).
- YC founders are 45% more likely to raise a Series A (source: New Economies).
- 50% of YC startups are still operating after 10 years (source: New Economies).
- A quarter of YC unicorns reach valuations above $10 billion (source: New Economies).
- Solo-founded companies are 36% to 37% of new Carta startups in 2026 (source: PMF).
- Roughly 25% of VC-backed founders are solo, versus about 10% a decade ago (source: PMF).
Team Size and Hiring Statistics
The AI efficiency thesis is visible in headcount at every stage.
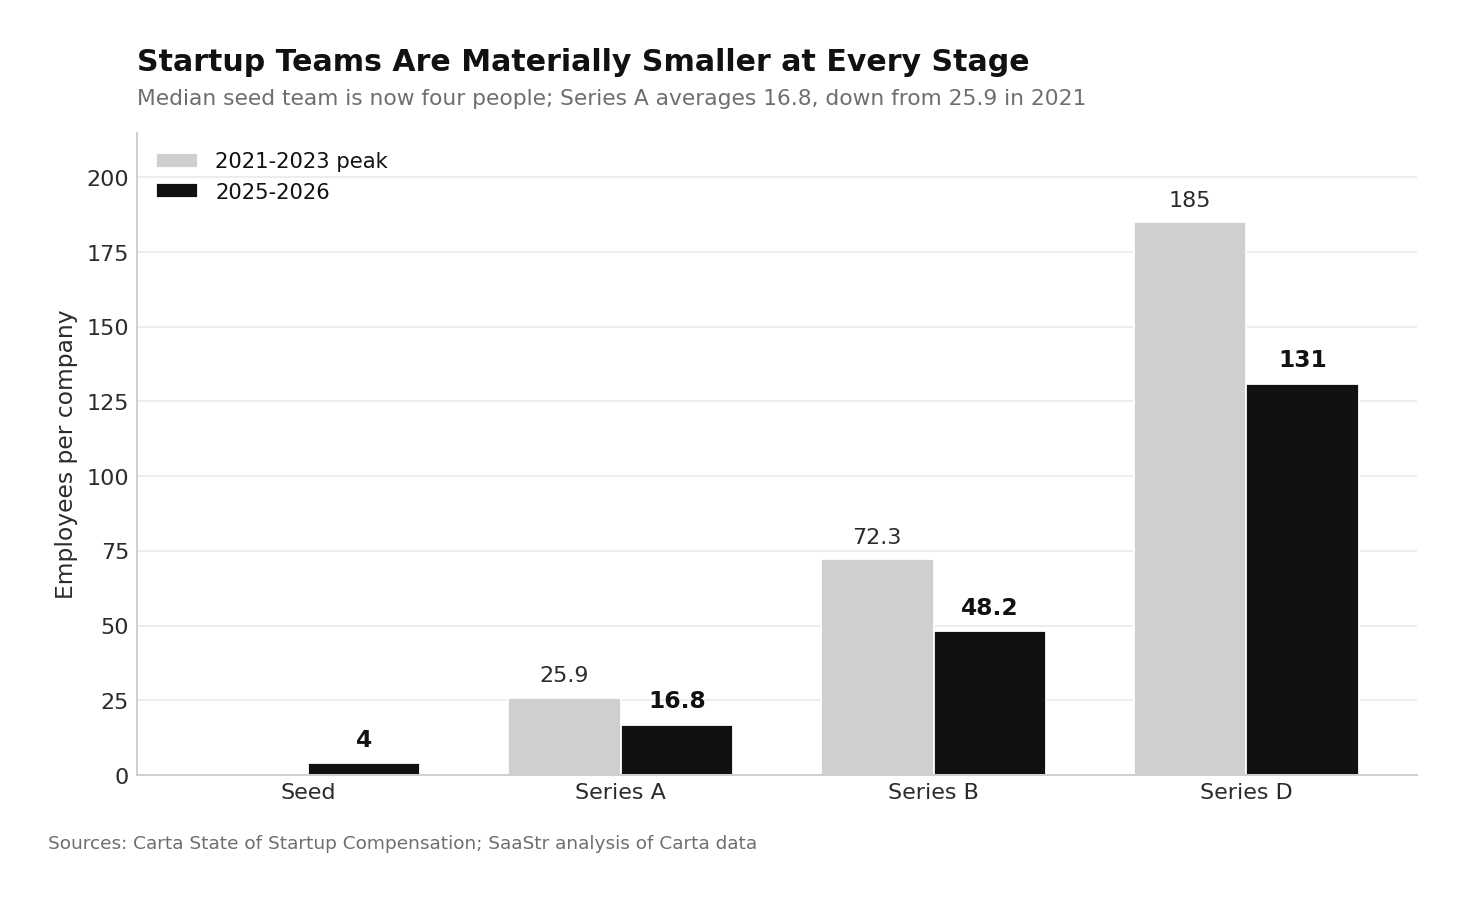
- Median team size at seed is now four employees (source: Carta).
- Series A teams average 16.8 employees, down from 25.9 in 2021 (source: SaaStr).
- Series B teams average 48.2, down from 72.3 in 2022 (source: SaaStr).
- Average Series D headcount fell 29% from its 2023 peak to 131 (source: Carta).
- Median time to first hire rose from 214 days in 2019 to 284 in 2024 (source: SaaStr).
More context sits in our 2026 hiring statistics.
Startup Salary Statistics
Smaller teams mean more capital per remaining employee, and pay has responded.
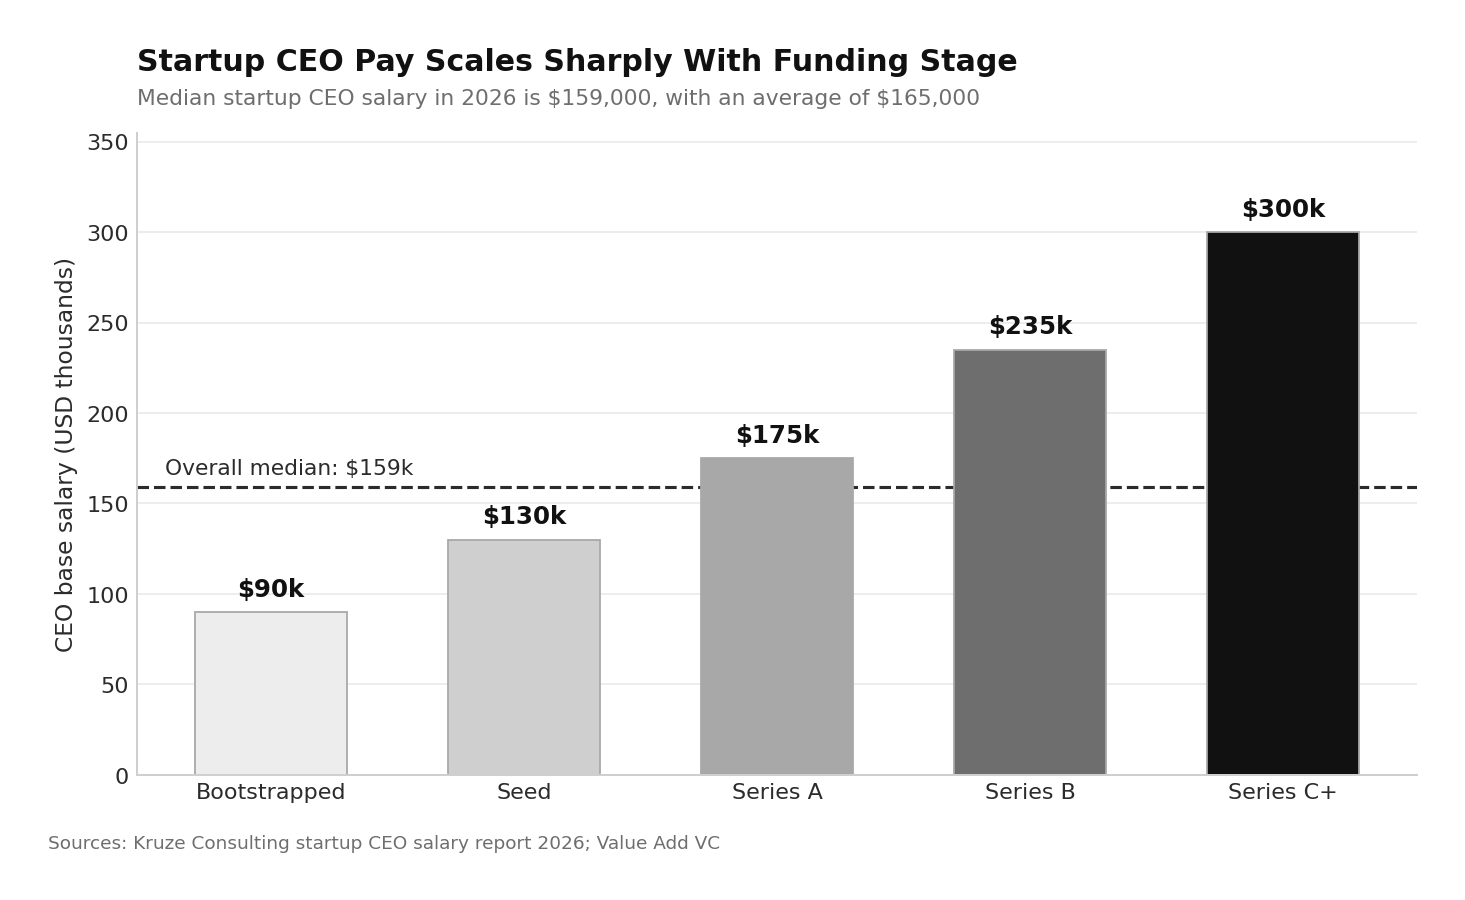
- The average startup CEO salary in 2026 is $165,000, with a median of $159,000 (source: Kruze Consulting).
- CEO base pay runs roughly $90,000 bootstrapped, $130,000 at seed, $175,000 at Series A, $235,000 at Series B and $300,000 at Series C and beyond (source: Value Add VC).
- Seed senior engineers earn $140,000 to $175,000 base plus 0.20% to 0.60% equity (source: Remvix).
- Series A senior engineers earn $160,000 to $200,000 base plus 0.07% to 0.20% equity (source: Remvix).
- Staff engineers earn $165,000 to $210,000 base plus 0.40% to 1.0% equity (source: Remvix).
- 67% of companies publish salary bands, up from 41% in 2023 (source: Remvix).
- Median AI/ML engineer equity grants rose 31% between January 2024 and February 2026 (source: Carta).
- Median AI/ML engineer salary rose 9.1% over the same period (source: Carta).
- Median individual contributor equity grants rose nearly 11% over two years (source: Carta).
- Median individual contributor salary rose 6.4% (source: Carta).
- Startup equity has roughly an 18% chance of returning anything material at Series A (source: Cadence).
- Late-stage startups pay 31% to 34% more than early-stage for senior talent (source: Ravio).
See also this 2026 startup salaries report and our average salary by age data.
Founder Diversity Statistics
- All-female founding teams receive 2.3% of total venture capital (source: WomenHack).
- Mixed-gender founding teams receive 15.6% (source: WomenHack).
- Female founders raise median seed rounds of $1.1 million versus $2.1 million for men (source: WomenHack).
- 37% of tech startups have at least one female founder, up from 28% in 2019 (source: WomenHack).
- Only 17.3% of VC decision-making roles are held by women (source: Theanna).
- Women-founded companies generate 78 cents per dollar invested versus 31 cents (source: EquityZen).
- Around 2% of Silicon Valley VC funding goes to Black-founded startups (source: Startup Edition).
What the 2026 Data Means for Founders
Three patterns hold across every dataset above:
- The funding record is real but narrow: two companies took 43% of H1 capital, so founders outside the frontier-AI cohort should benchmark against seed and Series A medians rather than headline totals.
- The bar for a priced round rose faster than valuations, with median Series A ARR moving from roughly $1 million to $3.5 million while seed teams shrank to four people.
- Liquidity returned, which historically pulls fresh limited partner capital back into the ecosystem within 12 to 18 months.
The practical implication is that capital efficiency now outranks growth rate at the earliest stages.
With 29% of shutdowns caused by running out of cash and bootstrapped companies surviving at nearly double the venture-backed rate, runway is a survival metric rather than a preference.
Review operating benchmarks by ARR stage before setting 2027 targets.
How to Read Startup Statistics Without Being Misled
Startup data is easy to quote and easy to misuse, and three cautions apply to every number here.
Definitions differ. The 90% failure rate applies to venture-scale startups, while 20.4% covers all registered private-sector businesses. Mixing them produces nonsense.
Reporting lags are real. Seed totals rise significantly after a quarter closes, so recent early-stage figures are systematically understated at publication.
Platform data is not market data. Carta figures cover companies on Carta, and Crunchbase figures cover reported deals.
Both are large samples; neither is a census. Where sources disagree, check the population before assuming one is wrong.
Conclusion
B2B Centr publishes the benchmark data operators use to price decisions rather than guess at them.
The 2026 startup market delivered a record $510 billion in first-half funding, 195 new unicorns by mid-year and the strongest exit window since 2021, while roughly half of all new businesses still fail within five years and only one in ten seed companies reaches a Series A within twelve months.
Both realities are true at once, and the gap between them is the story of the year.
Teams that plan against the medians rather than the headlines will make better calls in the year ahead.
Read Next
FAQs
1. What is the total startup funding raised globally in 2026?
The total startup funding raised globally in 2026 reached $510 billion in the first half alone, surpassing all of 2025's $440 billion, split between $305 billion in Q1 and $205 billion in Q2 (source: Crunchbase).
2. What percentage of startups fail in 2026?
The percentage of startups that fail in 2026 is roughly 20.4% within year one, 49.4% within five years and 65.3% within ten years for all US businesses, while about 90% of venture-scale startups fail eventually (source: MakerStations).
3. How many new unicorns were created in 2026?
The number of new unicorns created in 2026 reached 250 through August 15, including 195 in the first half, which already exceeded the 193 minted across all of 2025 (source: Crunchbase).
4. What is the average startup CEO salary in 2026?
The average startup CEO salary in 2026 is $165,000 with a median of $159,000, ranging from roughly $90,000 at bootstrapped companies to about $300,000 at Series C and beyond (source: Kruze Consulting).
5. What is the seed to Series A graduation rate in 2026?
The seed-to-Series A graduation rate in 2026 is 10% to 11% of the 2025 cohort within one year, up from 4% to 5% in 2022 and 2023, with median time to Series A now around 774 days (source: PMF).
Disclaimer: This content is provided for informational purposes only and does not constitute legal, financial, or compliance advice. Protocol versions, governance arrangements, and partner counts cited here reflect publicly announced milestones as of August 2026 and are moving quickly. Adoption figures come from vendor and foundation announcements with differing methodologies and should be treated as directional signals rather than guaranteed outcomes.