

Marketing budgets averaged 7.8% of company revenue in 2026, barely moving from 7.7% the year before, while CMOs pushed 15.3% of those budgets into AI initiatives (source: Gartner 2026 CMO Spend Survey).
B2B Centr tracks the cost and benchmark data behind B2B growth decisions, from customer acquisition cost to headcount to channel spend, so operators can plan against real numbers instead of folklore.
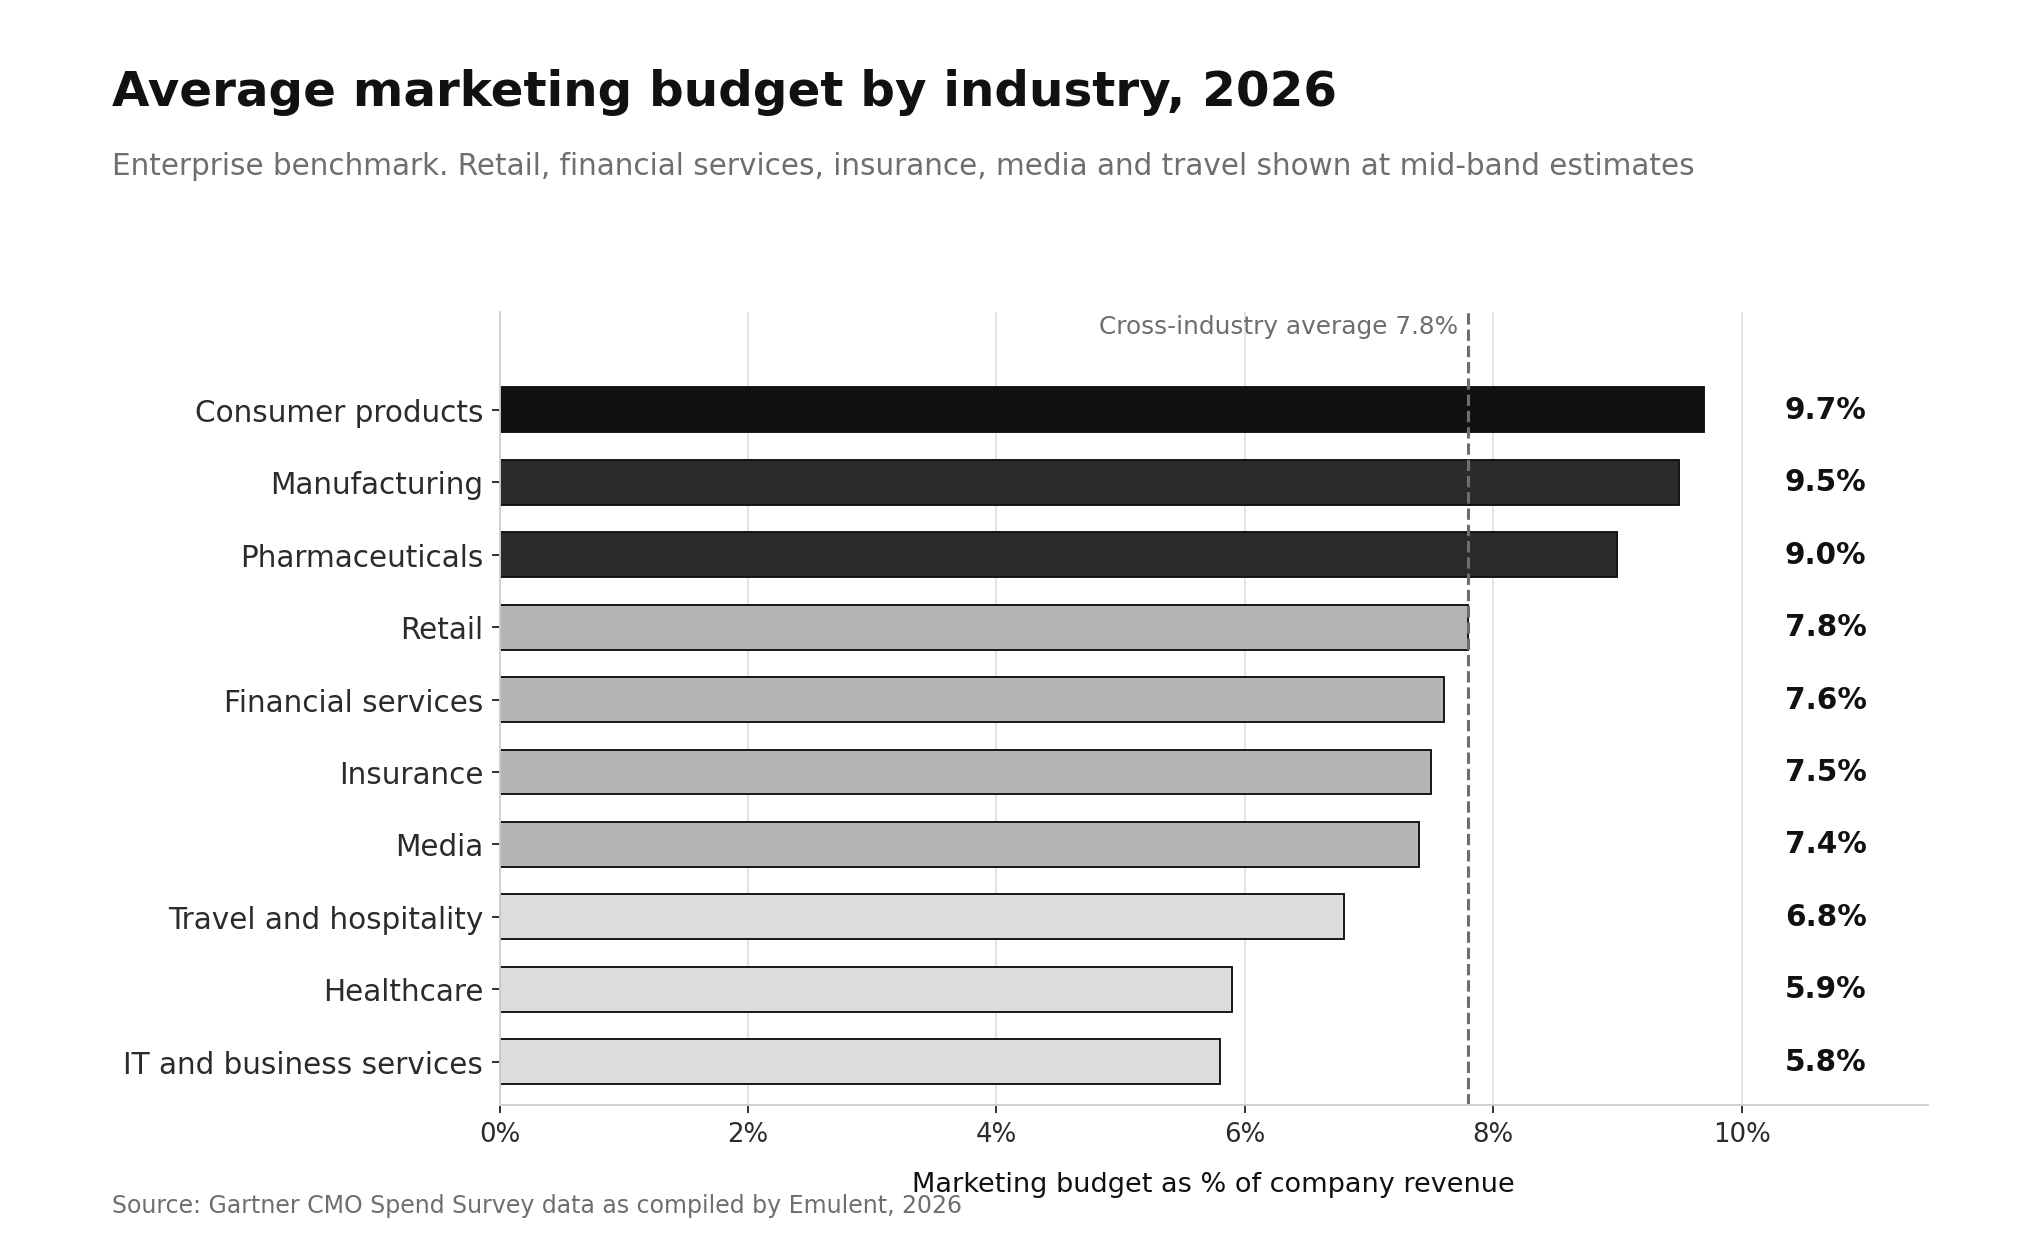
The problem with the 7.8% headline is that almost no company actually lives there: consumer products firms run above 9.7% of revenue while IT and business services firms run at 5.8%, a spread wide enough to make the cross-industry average useless as a planning input.
This report breaks down the average marketing budget by industry, by go-to-market motion, by company size, and by where the money goes once it is inside the budget.
Key Takeaways
- Marketing budgets sit at 7.8% of revenue in enterprise samples, 9.0% in broader samples.
- Industry spread runs from 5.8% to 9.7% of revenue, roughly a six-fold gap.
- B2C product companies spend 12.0% of revenue; B2B product companies spend 7.0%.
- Paid media takes 31.4% of budget, martech 19.4%, both at multi-year extremes.
- Company size predicts budget percentage better than industry classification does.
The Market Context: A Trillion-Dollar Ad Economy on a Flat Budget
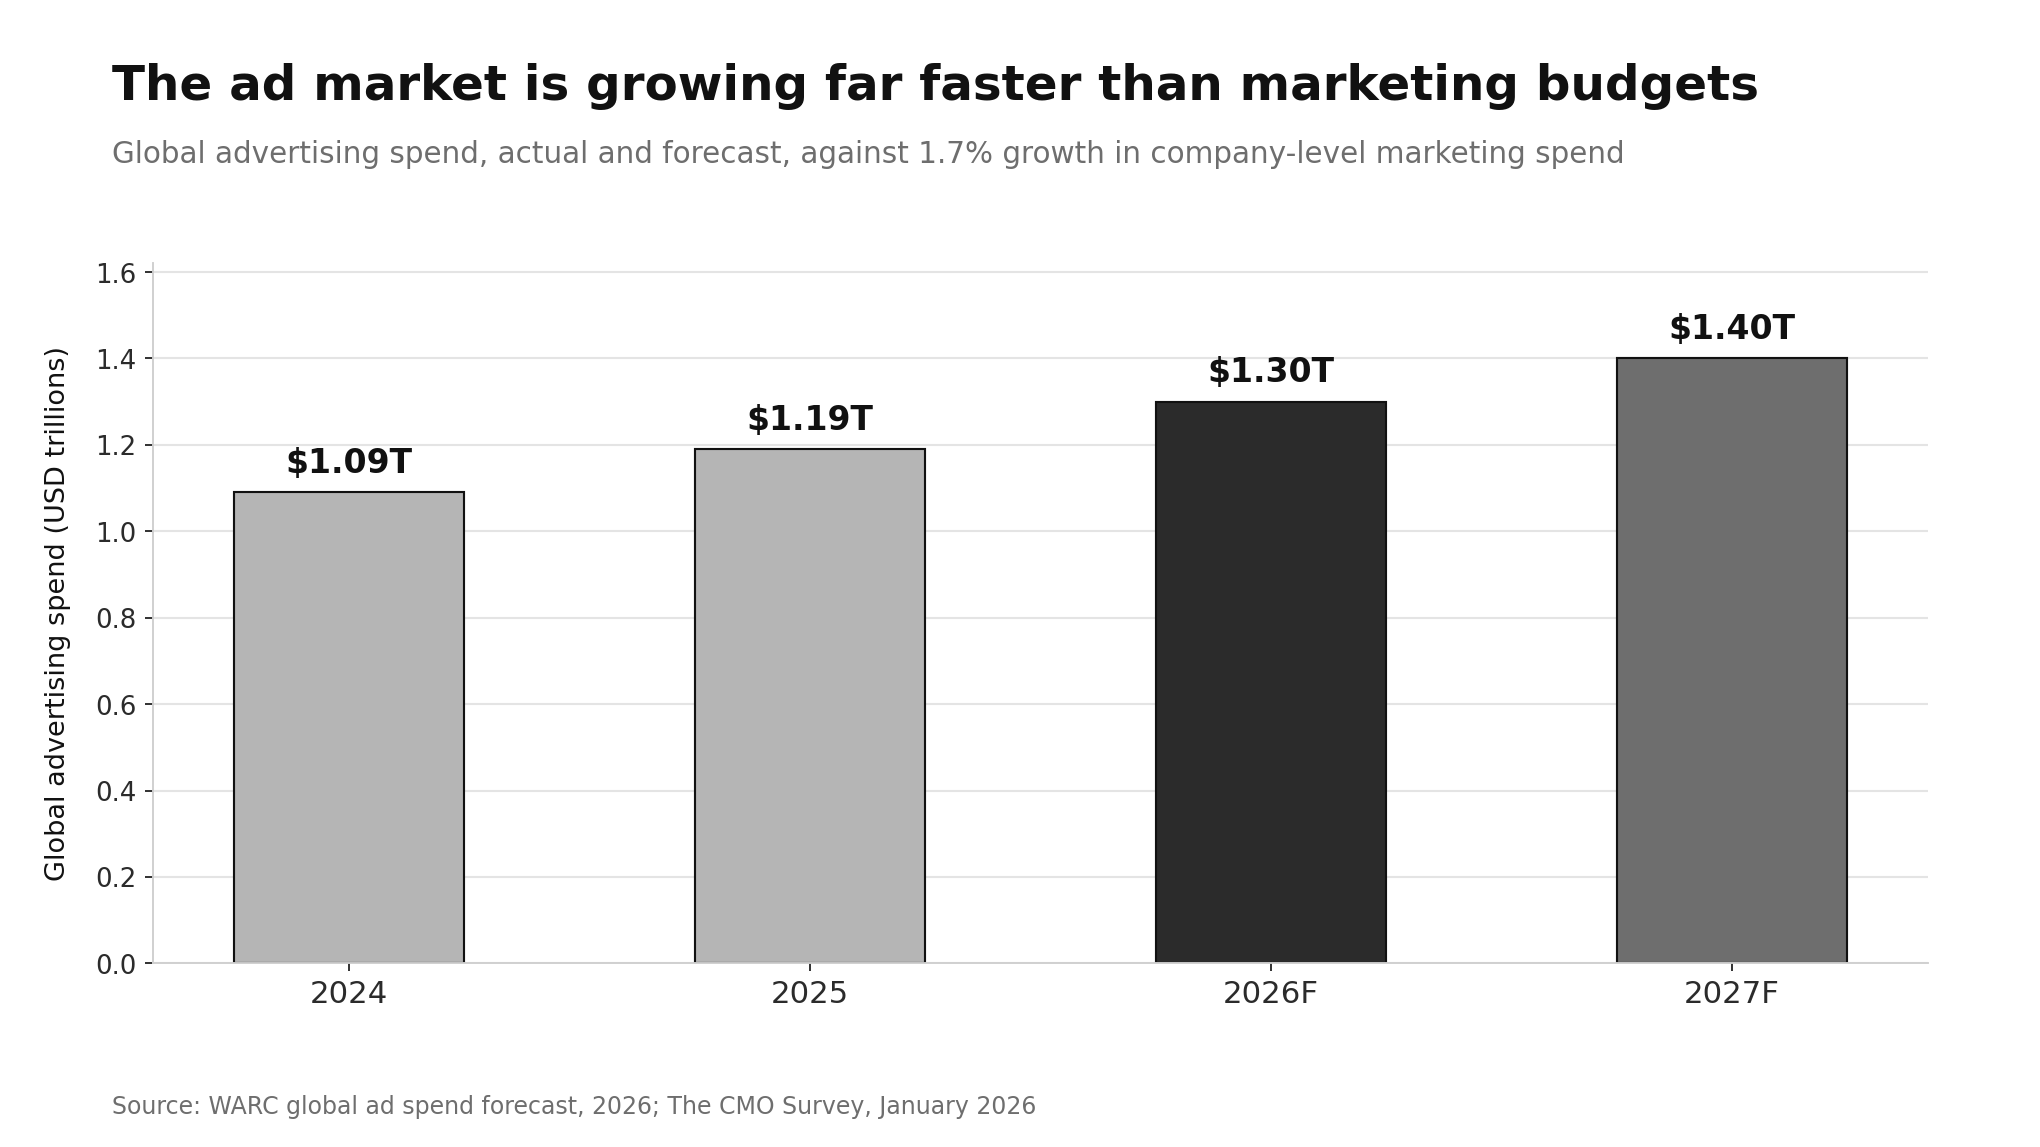
The disconnect defining 2026 is that the advertising market is growing far faster than the marketing budgets funding it.
Global advertising spend is forecast to reach $1.30 trillion in 2026, up 9.1% year over year and double its pandemic-era size (source: WARC).
A separate forecast puts global spend crossing the trillion-dollar mark for the first time with digital taking 68.7% of total investment (source: dentsu).
Company-level budgets are not keeping pace.
Overall marketing spending grew just 1.7% over the trailing twelve months in early 2026, the weakest reading since 2021, while digital marketing spending grew 8.2% (source: CO Consulting).
The gap between market-level growth and firm-level growth means media inflation is eating budget share before a single new campaign launches.
That pressure shows up unevenly across sectors, which is where the industry breakdown starts to matter.
Why Two Credible Sources Disagree on the Average
Any honest breakdown of average marketing budget by industry has to address a methodological split first.
The two most cited datasets produce different headline numbers, and neither is wrong.
Gartner reported 7.8% of revenue in 2026, up marginally from 7.7% in 2025 and well below the 9.5% recorded three years earlier (source: Gartner).
The CMO Survey, run by Duke University's Fuqua School of Business with Deloitte and the American Marketing Association, reported 9.0% of revenue in its January 2026 edition, down from 9.4% in spring 2025 (source: CO Consulting).
The 1.2-point gap is sampling, not disagreement.
Gartner surveys 401 marketing leaders concentrated in enterprises above $1 billion in revenue across North America, the UK, and Europe.
The CMO Survey covers 308 US firms across a much wider size range, and smaller companies consistently allocate a higher share of revenue to marketing.
Read Gartner when benchmarking an enterprise, read The CMO Survey when benchmarking a mid-market or growth-stage business, and never blend the two.
Average Marketing Budget by Industry: The Enterprise Breakdown
Within the enterprise sample, industry classification produces a spread far wider than the year-over-year movement in the headline average.
| Industry | Marketing budget as % of revenue |
|---|---|
| Consumer products | 9.7% |
| Manufacturing | 9.5% |
| Pharmaceuticals | 9.0% |
| Retail | 7.1% to 8.0% |
| Financial services | 7.1% to 8.0% |
| Insurance | 7.1% to 8.0% |
| Media | 7.1% to 8.0% |
| Travel and hospitality | Below 7.0% |
| Healthcare | 5.9% |
| IT and business services | 5.8% |
Three sectors sit above 9%:
- Consumer products
- Manufacturing
- Pharma.
Four sit below 7%:
- Travel and hospitality
- Healthcare
- IT and business services, and tech services firms above $250M in revenue.
The middle band from 7.1% to 8.0% captures:
- Retail
- Financial services
- Insurance
- Media
That is where most enterprise CMOs will find their peer group (source: Emulent).
Broader samples that include smaller firms push the top of the range much higher.
Consumer packaged goods companies have been measured near 18% of revenue, communications and media close behind, technology and software between 11% and 15%, financial services between 7% and 10%, and energy near 3% (source: Boomcycle).
Healthcare and pharma show the widest internal range of any category, roughly 6% to 14%, because a pharma company running national television campaigns and a regional health system relying on physician referrals share a classification code and nothing else.
For software specifically, the picture is more granular than any industry table can capture.
Our SaaS marketing budget breakdown for 2026 covers how ARR stage changes the number, and B2B SaaS CAC benchmarks explain why two SaaS companies at identical revenue can justify very different spend.
B2B Versus B2C: The Split That Beats Industry Classification
Go-to-market motion predicts marketing intensity better than sector code.
In the January 2026 edition of The CMO Survey, business-to-consumer product companies spent 12.0% of revenue on marketing, business-to-business services companies spent 10.1%, business-to-consumer services 7.2%, and business-to-business product companies 7.0% (source: CO Consulting).
The gap was wider a year earlier, with B2C product at 15.5% against 6.4% for B2B product, a 2.4x ratio (source: Emulent).
The 2026 narrowing reflects softer consumer-side budgets rather than any structural convergence.
The underlying logic is simple. B2C product brands compete for mental availability against near-identical substitutes, and that preference decays the moment spending stops.
B2B companies buy their way into a considered purchase with long cycles, multiple stakeholders, and high switching costs, which lets a smaller percentage go further.
B2B teams also still commit 15% to 20% of budget to trade shows and industry events, a line item most consumer brands abandoned years ago. That commitment is holding: nearly half of B2B teams raised event budgets in 2026.
Digital growth rates diverge just as sharply.
B2C services companies reported the fastest digital marketing spending growth at 16.6%, followed by B2C product at 12.6%, B2B services at 7.1%, and B2B product at 4.1%.
Company Size and Growth Stage Move the Number More Than Sector
The CMO Survey data shows a negative correlation between total sales and marketing budget as a percentage of revenue.
Bigger companies spend a smaller share, which is precisely why enterprise-weighted surveys produce lower averages.
Practical planning ranges by stage look roughly like this:
- Early-stage companies in their first two years typically need 12% to 20% of projected revenue because they have no brand equity or installed base to convert.
- Growth-stage companies commonly run 10% to 15%.
- Established mid-market companies cluster near the 7% to 10% band.
- Enterprises above $1 billion in revenue mostly land between 5% and 9%, with half of surveyed CMOs reporting 6% or less (source: Gartner).
Margin structure sets the ceiling. A business running 5% net margins cannot spend the same share of revenue as one running 40% gross margins on software, regardless of what the industry table says.
Anchor the number to unit economics first, using customer lifetime value and payback period, then sanity-check against the industry benchmark.
Inside the Budget: Where Industry Dollars Actually Go
Knowing your industry percentage is only half the answer. The allocation inside that number has shifted materially over five years.
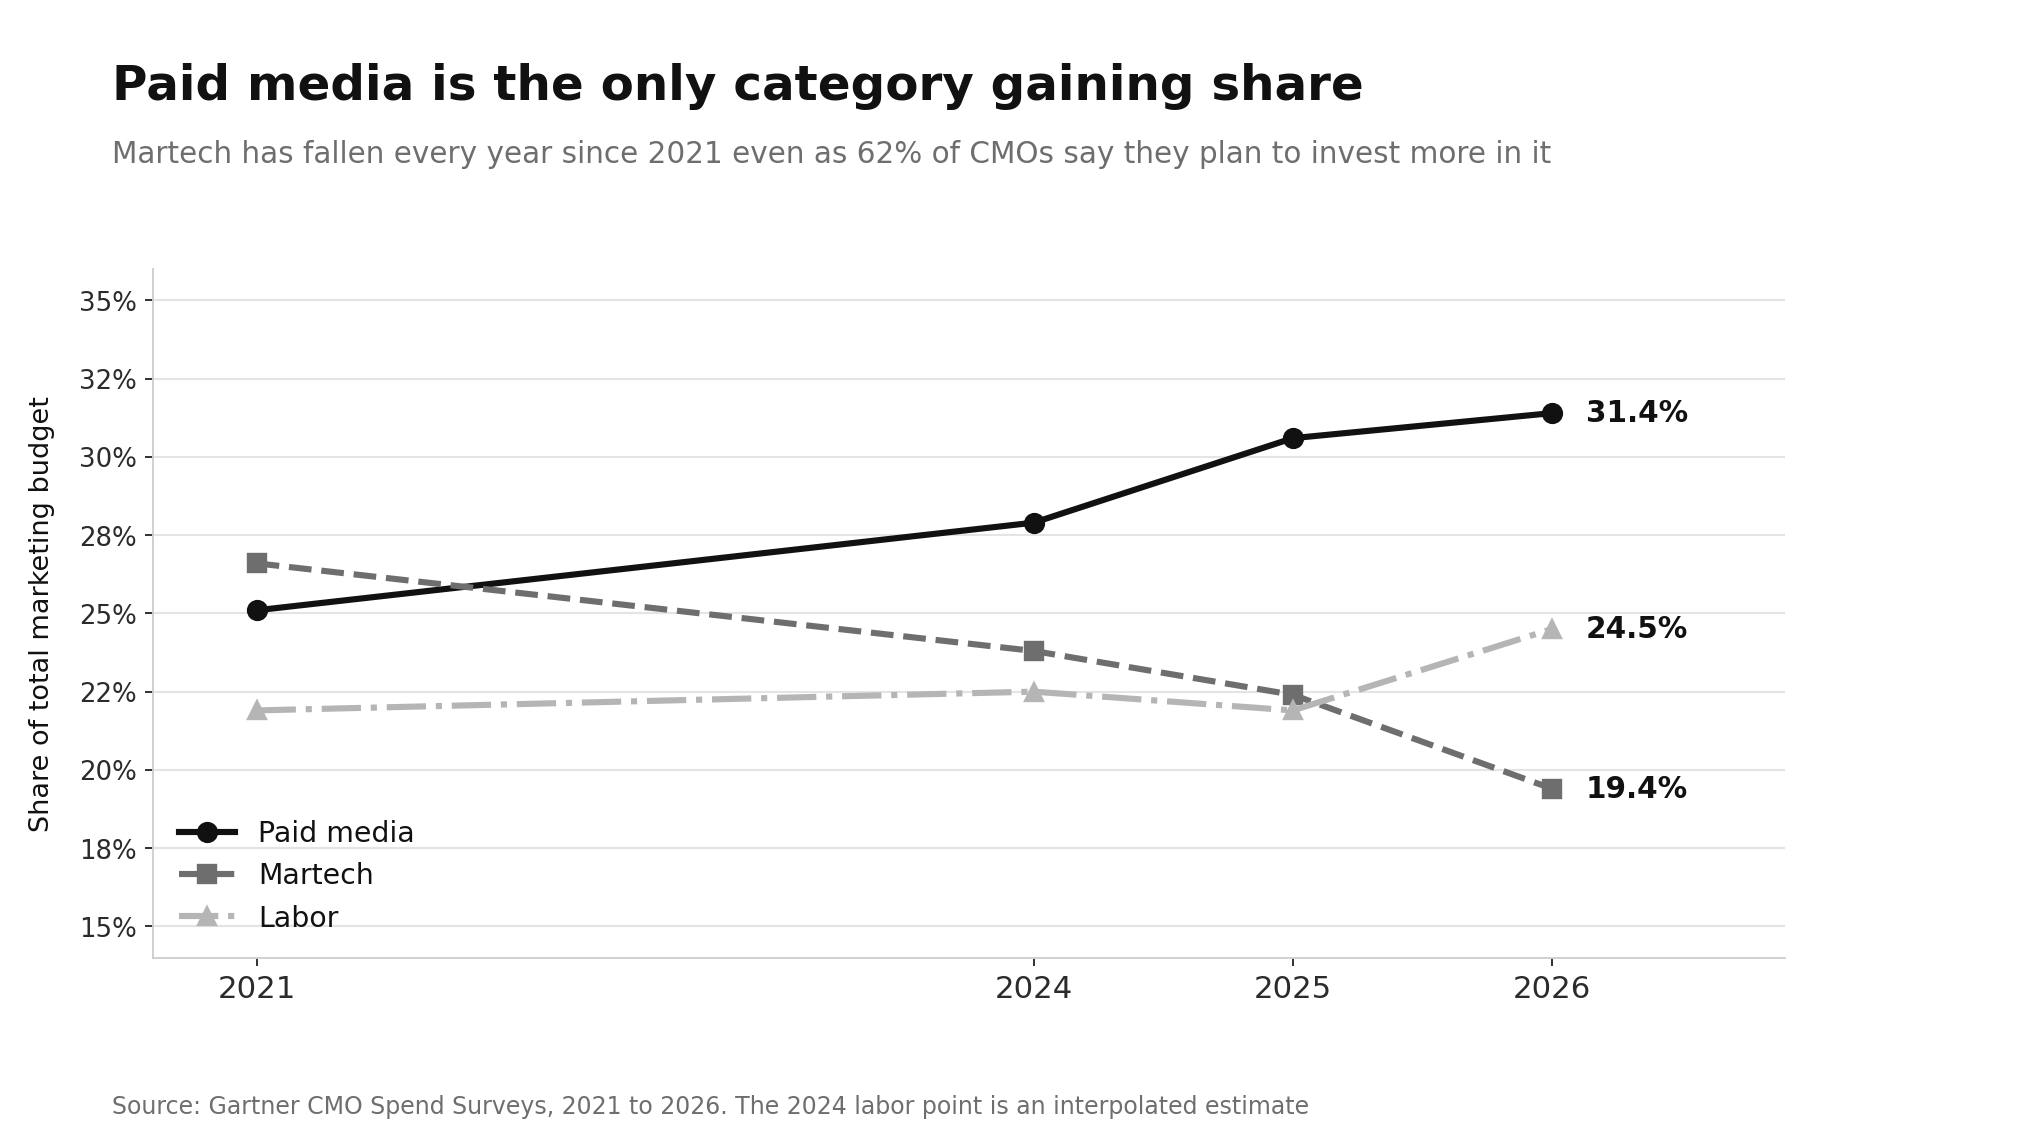
In the 2026 enterprise data, paid media took 31.4% of the marketing budget, labor 24.5%, and marketing technology 19.4%.
Paid media is the only category that has consistently grown its share, rising from 25.1% in 2021.
Martech has fallen every single year in the series, from 26.6% in 2021 to 19.4% in 2026, even though 62% of CMOs said they planned to invest more in marketing technology (source: CO Consulting).
That martech paradox is worth sitting with. Falling share alongside rising intent points to consumption-based pricing, AI consolidation collapsing several tools into one, and IT taking over more of the buying.
Roughly 56% of CMOs increased the share of martech budget allocated to consumption-based pricing while only 9% decreased it (source: Chief Marketer).
For teams working through that consolidation, rebuilding the martech stack for lean teams covers the sequencing, and our CRM cost breakdown for 2026 covers the single largest line item in most stacks.
Digital channels reached 67.5% of the enterprise marketing budget in 2026, up from 54.9% in 2023.
Traditional advertising has fallen to 3.8% of budgets with a further 1.5% decline projected.
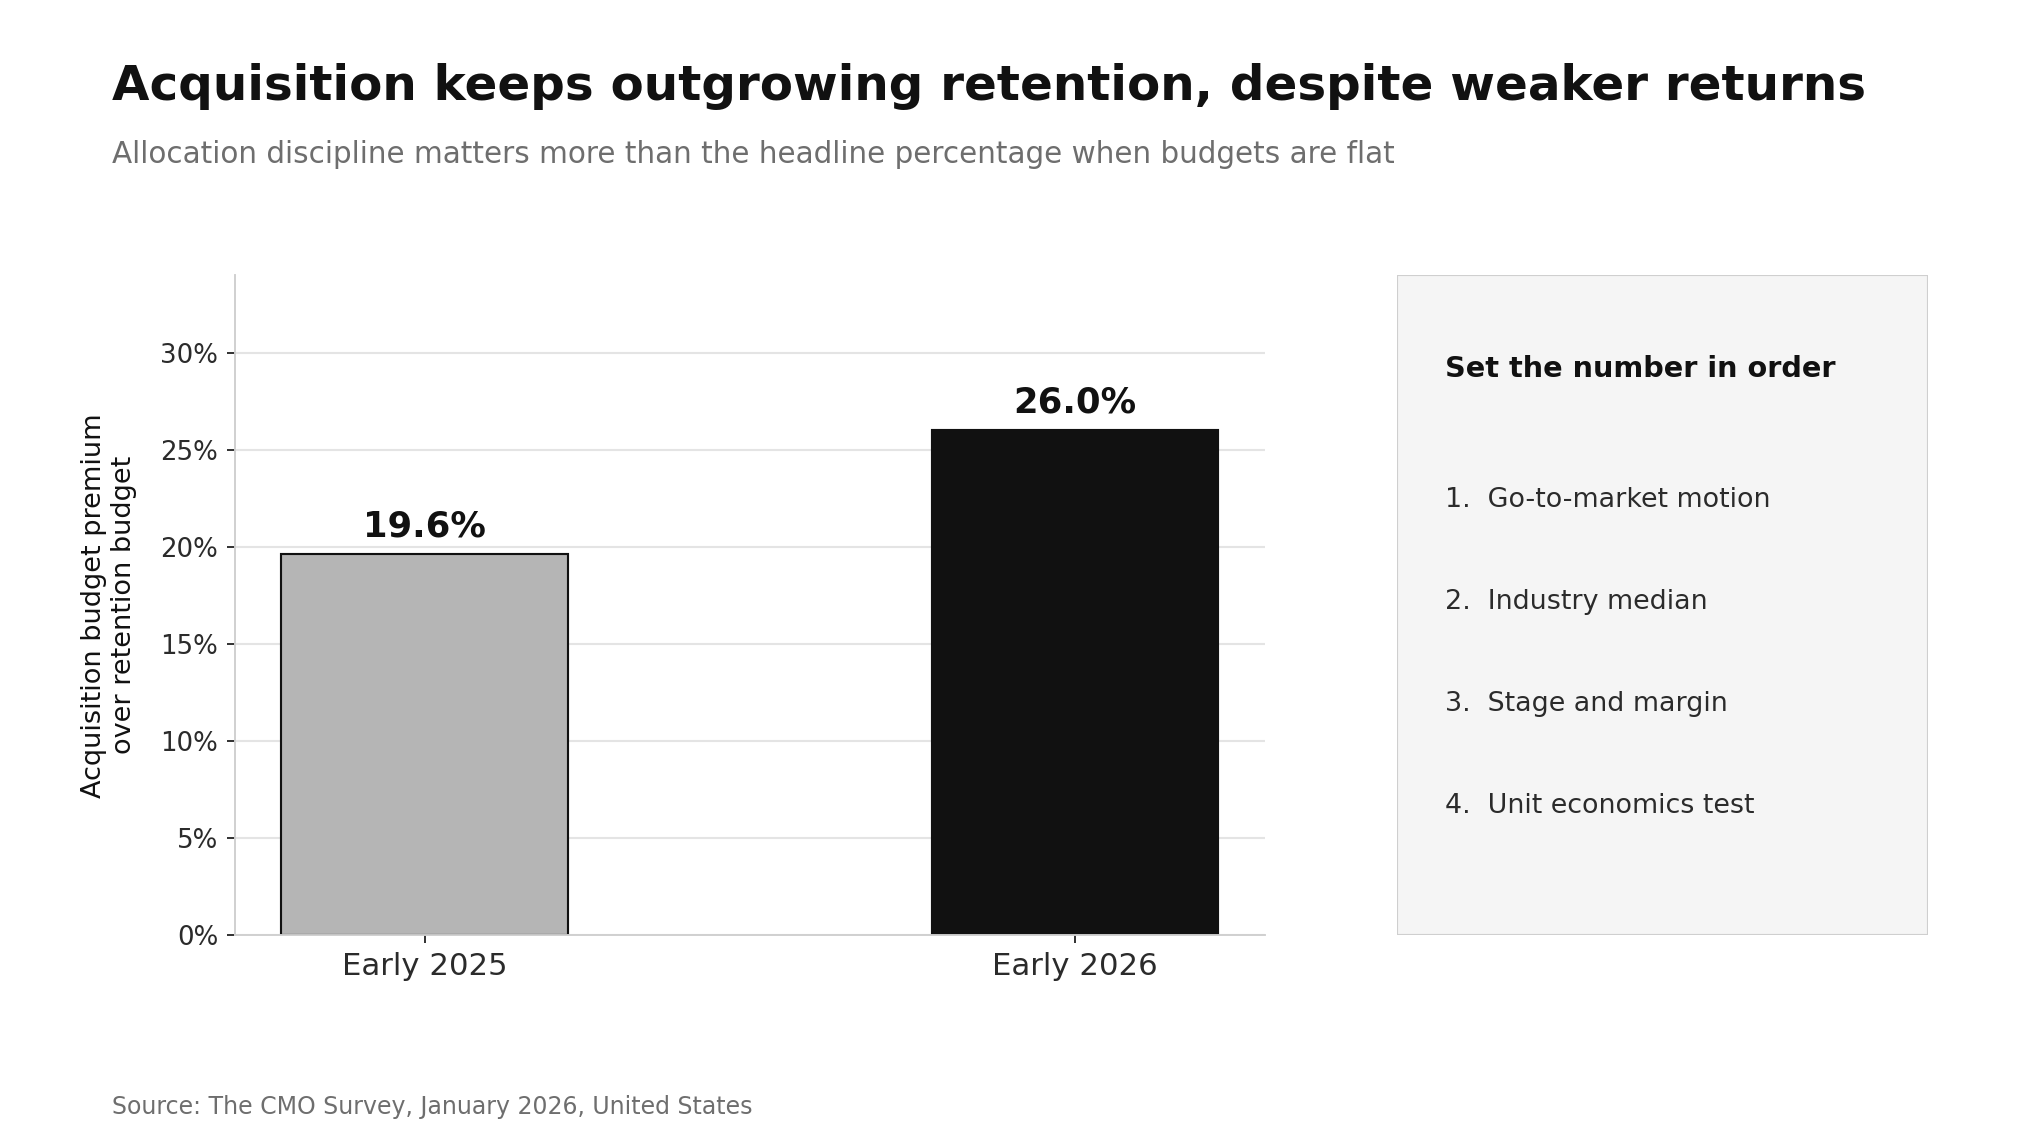
Acquisition budgets ran 26.0% larger than retention budgets in early 2026, up from 19.6% a year earlier, despite retention posting stronger measured performance.
Channel-level unit costs then determine what those percentages actually buy.
Our current data on Google Ads CPC in 2026 and SEO cost benchmarks shows how much industry-level price inflation varies before any strategy decision is made.
What Marketing Headcount Costs by Industry
Labor is roughly a quarter of the enterprise marketing budget, so salary benchmarks are not a side note. They are the second-largest line item.
US marketing managers earned a median wage of $166,790 and a mean of $177,770 across 395,240 jobs in May 2025, while market research analysts and marketing specialists formed the largest group at 899,580 jobs with a median of $78,760 (source: CO Consulting).
Advertising and promotions managers sat lower at a $126,960 median, and the occupation is projected to grow 6% through 2034 (source: U.S. Bureau of Labor Statistics).
Geographic and sector variance is extreme.
Massachusetts led all states for marketing managers at a $213,230 mean and the San Jose metro reached $255,360, while Mississippi paid $120,770.
Within roles, product marketing managers command the highest manager-level median at $152,553, ahead of growth marketing at $131,185 and demand generation at $123,222 (source: GTM 8020).
The practical implication for budget planning: a five-person marketing team in a high-cost metro consumes roughly $700K to $900K in fully loaded compensation before a dollar of media spend.
At a 7% budget on $20M revenue, that is most of the budget.
This is exactly why many mid-market companies pair a lean in-house team with a fractional CMO rather than a full executive hire, and why SDR cost benchmarks belong in the same conversation.
Which Industries Gained and Lost Budget
The flat headline average conceals significant reshuffling.
IT and business services posted the steepest single-year decline of any sector, dropping from 9.0% to 5.8% of revenue, a cut premised on the belief that AI tooling can absorb demand generation and account-based marketing work that used to be labor-intensive (source: Chief Marketer).
On the other side, consumer products gained 3.0 points in a single year, manufacturing added 2.8 points, and pharma added 2.0 points, responses to tariff pressure, GLP-1-driven category disruption, and reshoring competition (source: Emulent).
Healthcare, travel and hospitality, insurance, and media all decreased.
Directionally, CMOs in consumer products, manufacturing, and pharma reported the largest budgets as a share of revenue while healthcare, travel and hospitality, and IT and business services reported the smallest (source: Marketing Brew).
For the broader shifts driving those moves, B2B marketing trends for 2026 and where CMO budgets are going by category provide the category-level detail.
The AI Divide Is Now a Budget Divide
The single most useful finding for 2026 planning is that AI maturity now correlates with budget size, not just budget efficiency.
Organizations Gartner classifies as AI strategists, those with fully optimized internal AI processes, reported marketing budgets averaging 8.9% of revenue against 7.8% for all respondents, and allocated 21.3% of budget to AI against a 15.3% survey mean (source: Chief Marketer).
At the extreme, organizations with fully optimized AI processes were reported allocating around 11% of total revenue to marketing (source: MarketScale).
On a $500M revenue base, the difference between 7.8% and 11% is roughly $16M a year.
Readiness is the constraint, not appetite.
Only 30% of CMOs said they were ready to scale AI capabilities despite the spending, and AI was already embedded in 24.2% of marketing activities in early 2026, up from 13.1% in 2024, with companies projecting 55.9% within three years.
Setting Your Own Number
Benchmarks tell you where your peer group sits. They do not tell you what to spend.
A defensible budget comes from four inputs in order:
- Start with your go-to-market motion, because B2B versus B2C is more predictive than sector.
- Layer your industry median second, using the enterprise table if you are above $1 billion in revenue and the broader ranges if you are not.
- Adjust third for stage and margin, moving up for growth mandates and down for maintenance.
- Finally, pressure-test against unit economics, because a percentage that cannot produce an acceptable payback period is the wrong percentage regardless of what peers spend.
The reallocation usually matters more than the total.
Spreading 9% of revenue across eight channels produces activity without results, while the same budget concentrated on two or three channels where buyers already are produces measurable pipeline.
Measurement discipline is what makes that concentration defensible, which is why marketing mix modeling and marketing ROI benchmarks belong in the budget conversation, not after it.
Conclusion
B2B Centr exists to replace guesswork with benchmark data, and marketing budget planning is where guesswork costs the most.
The average marketing budget by industry ranges from roughly 5.8% of revenue in IT and business services to 9.7% in consumer products within enterprise samples, and considerably wider once smaller firms enter the picture, with go-to-market motion and company size explaining more of the variance than sector classification does.
Inside those budgets, paid media has climbed to 31.4% of spend, martech has fallen to a multi-year low of 19.4%, labor consumes roughly a quarter, and AI now claims 15.3% and rising.
The teams pulling ahead are not the ones with the largest percentage.
They are the ones reallocating a flat percentage toward channels and assets that compound.
Read Next
FAQs
1. What is the average marketing budget by industry in 2026?
The average marketing budget by industry in 2026 ranges from about 5.8% of revenue in IT and business services to 9.7% in consumer products, with manufacturing at 9.5%, pharmaceuticals at 9.0%, healthcare at 5.9%, and retail, financial services, insurance, and media clustered between 7.1% and 8.0%. The cross-industry average sits at 7.8% of revenue in enterprise samples and 9.0% in broader US samples.
2. How much should a B2B company spend on marketing?
A B2B company should spend roughly 7.0% of revenue if it sells products and roughly 10.1% if it sells services, based on January 2026 survey data. Early-stage B2B companies typically need 12% to 20% of projected revenue to build awareness they do not yet have, while established enterprises commonly run between 5% and 9%.
3. Why do marketing budget benchmarks vary so much between sources?
Marketing budget benchmarks vary between sources because the surveys sample different companies. Gartner draws from large enterprises mostly above $1 billion in revenue and reports 7.8%, while The CMO Survey includes a wide mix of US firm sizes and reports 9.0%. Smaller companies consistently spend a higher share of revenue, which explains the persistent 1 to 2 point gap.
4. What percentage of a marketing budget goes to paid media?
The percentage of a marketing budget going to paid media reached 31.4% in 2026, making it the largest single category and the only one growing its share over five years. Labor takes 24.5%, marketing technology 19.4%, and digital channels overall account for 67.5% of enterprise marketing budgets.
5. Which industries increased marketing budgets the most recently?
The industries that increased marketing budgets the most recently are consumer products, up 3.0 percentage points in a single year, manufacturing, up 2.8 points, and pharmaceuticals, up 2.0 points. These increases were largely defensive responses to tariff pressure, category disruption, and reshoring competition, while IT and business services, healthcare, travel and hospitality, insurance, and media all cut spend.
Disclaimer:
This content is provided for informational purposes only and does not constitute legal, financial, or compliance advice. Protocol versions, governance arrangements, and partner counts cited here reflect publicly announced milestones as of August 2026 and are moving quickly. Adoption figures come from vendor and foundation announcements with differing methodologies and should be treated as directional signals rather than guaranteed outcomes.